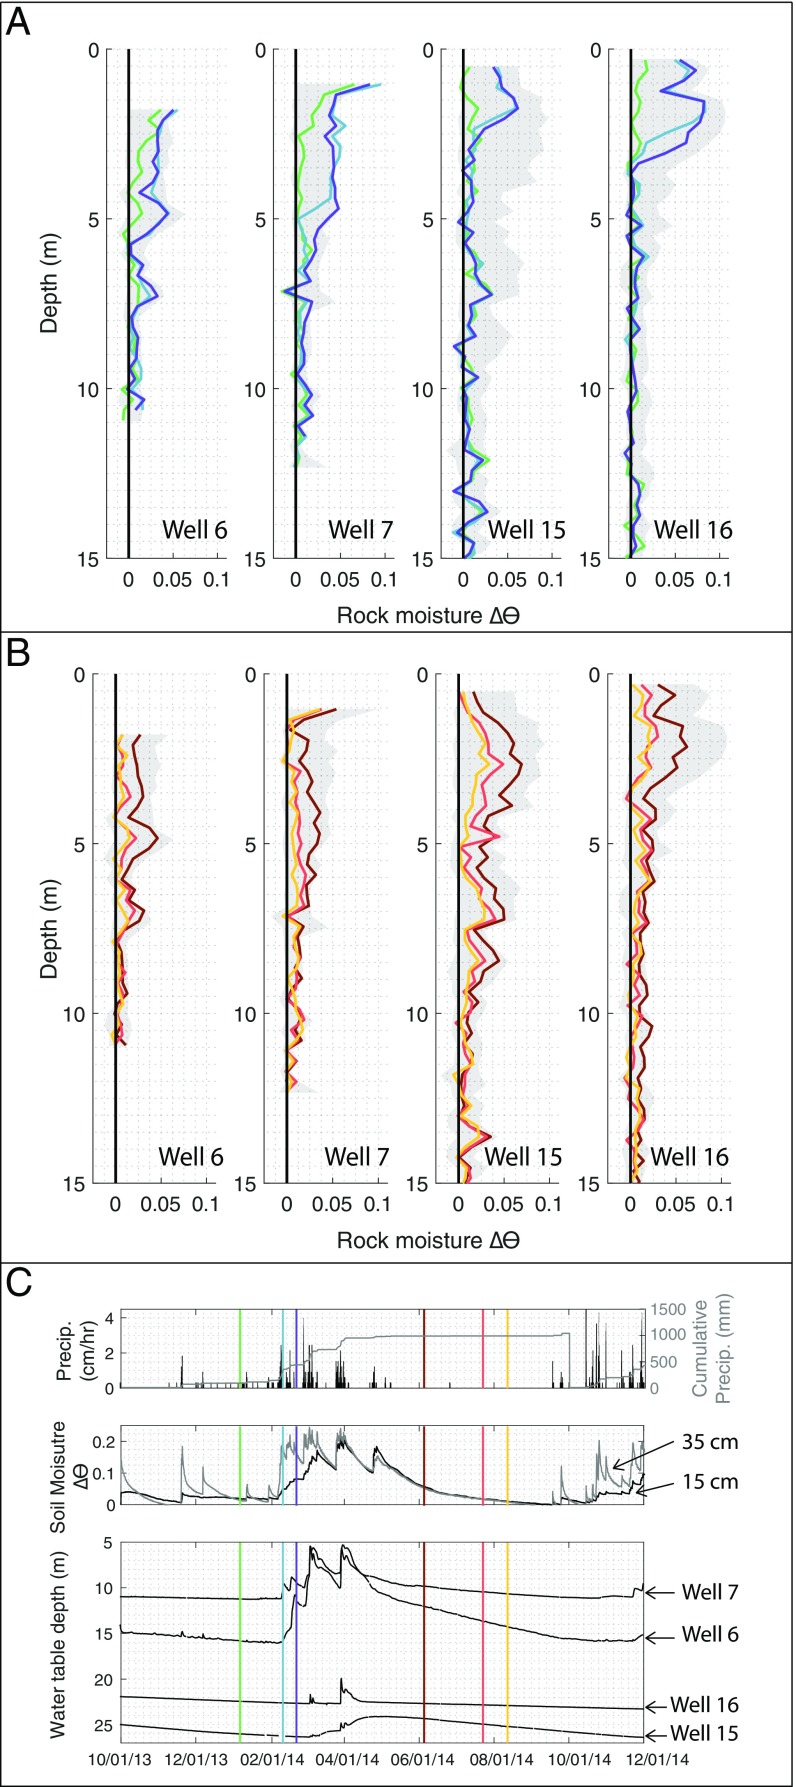
Fig. 3.
Seasonal soil moisture, rock moisture, and groundwater dynamics: Vertical profiles of rock moisture change, Δθ, illustrate that in the early wet-season, a wetting front progresses downward before the seasonal rise of the water table (A), while, during the dry season, rock moisture is progressively depleted (B), as groundwater recedes (C). Gray shading marks the total range of Δθ measured over the entire monitoring period (Materials and Methods). Colored lines in A and B correspond to the colored vertical lines marked in the precipitation, soil moisture, and groundwater level time series shown in C. Soil moisture dynamics at two depths near the ridge (15 and 35 cm) and groundwater dynamics in four wells are shown in C, Middle and Bottom. The locations of sensors and wells is shown in Fig. S1.

