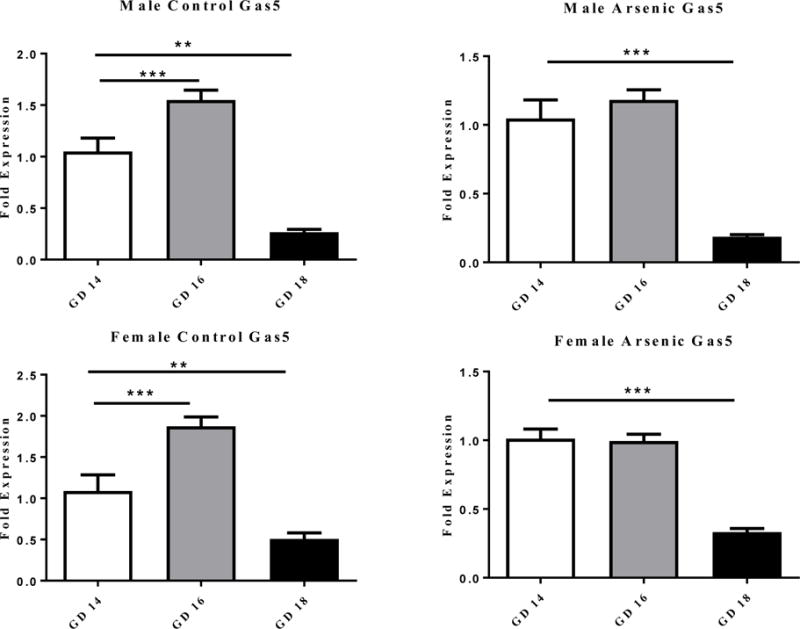
Figure 1.

The effect on the level of Gas5 RNA expression in male (top row of figures) and female (bottom row of figures) brain at GD 14, 16 and18. The developmental pattern of Gas5 expression is shown for the control (right column) and the prenatal arsenic exposed (left column) fetal brains. Fold expression of Gas5 was acquired by the ΔΔCt (Comparative CT) method. Arsenic exposed are presented in the filled columns and controls presented in the unfilled columns. Data presented are mean ±SEM n = 6–9, **p<.003, ***p< .0001.
