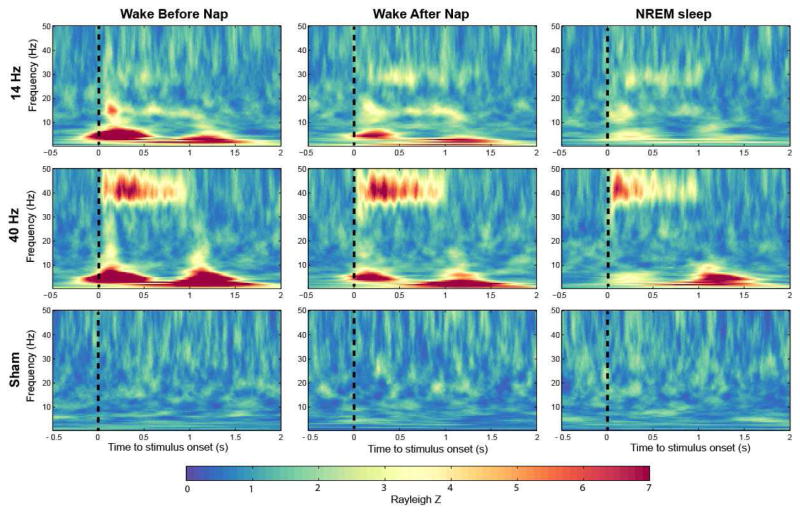
Figure 1.
Group averaged time–frequency maps of inter-trial phase coherence (ITPC) wakefulness before and after sleep, and during NREM (non-rapid eye movement) sleep (electrode FCz). Values are Rayleigh Z-corrected to account for unequal number of trials. Warm colors represent higher values and therefore stronger phase locking.

