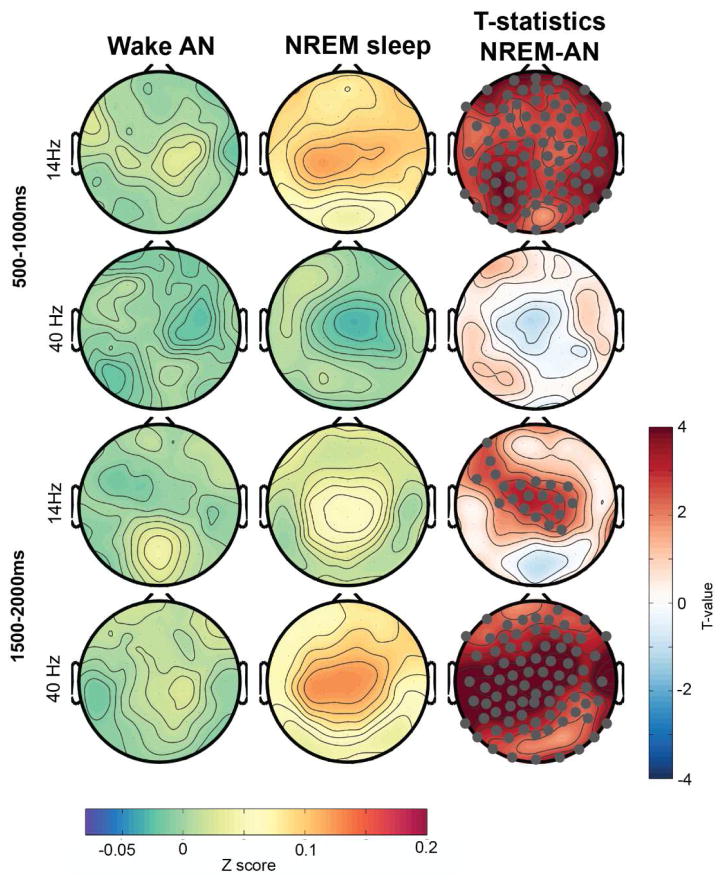
Figure 10.
Topographical distribution of z-scored wavelet amplitude in the spindle frequency range (11 – 16 Hz) for 14- and 40-Hz stimulation during both wakefulness and NREM sleep. Electrodes that showed significant difference using a paired t-test and survived SnPM and suprathreshold cluster analysis are marked in gray (in t-value maps). AN: After nap.

