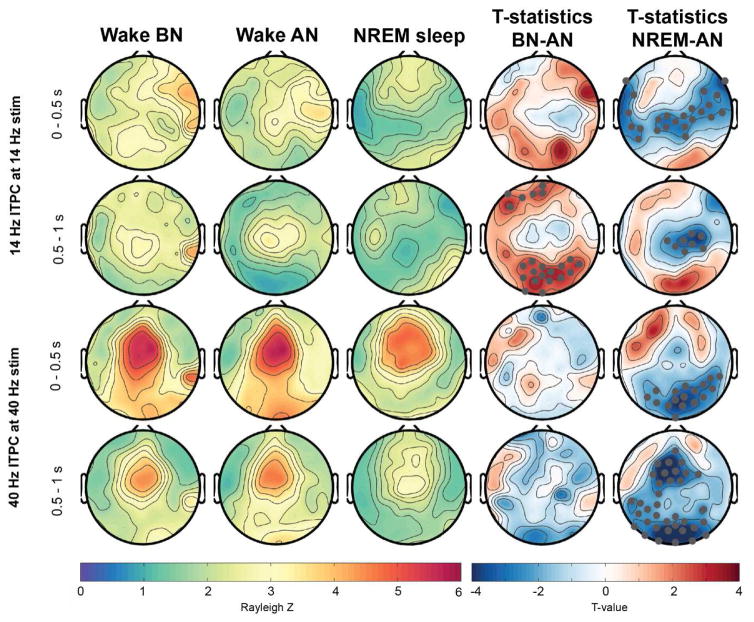
Figure 2.
Topographical (hdEEG) representation of ITPC response at 14- and 40-Hz across wakefulness and NREM sleep. Gray marked dots in the t-value maps indicate electrodes that significantly differ between the conditions and that survive SnPM and suprathreshold cluster analysis. BN: Before nap, AN: After nap.

