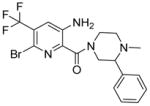
Table 1. Structures and IC50 values for active compounds.
IC50 values were determined in a cell based growth assay with the heterozygous SEC14 deletion strain against a wildtype control, with a luminescent cell viability assay on HCT116 cells and in an in vitro lipid transfer assay, as indicated. “nd” indicates “not determined”.
| Cpd | Structure | IC50 [μM] S. cerevisiae wildtype | fold IC50 shift S. cerevisiae wildtype/wildtypeΔ8 | IC50 [μM] S. cerevisiae SEC14/sec14 | IC50 [μM] HCT116 | IC50 [μM] lipid transfer |
|---|---|---|---|---|---|---|
| 1 |

|
13.5 | 13.8x | 5.9 | 30.4 | nd |
| 2 |

|
28.5 | 2.7x | 9.4 | >100 | 6.7 |
| 3 |

|
6.6 | 2.8x | 1.7 | >100 | 0.7 |
| 4 |

|
134.9 | 2.3x | 99.4 | >100 | 29.4 |
| 5 |

|
42.9 | 2.7x | 32.6 | >100 | 30.7 |
| 6 |

|
>200 | nd | >200 | >100 | 129 |
