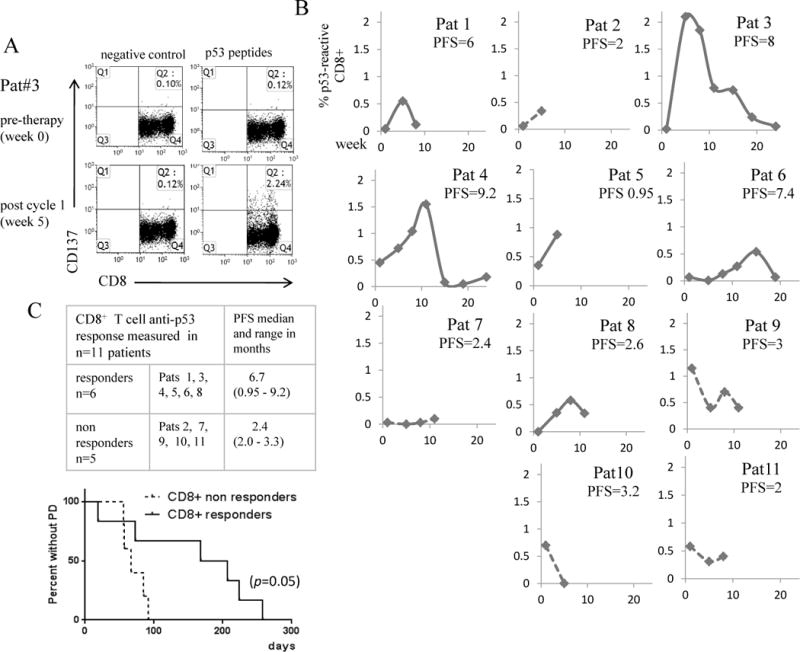
Figure 3. Expansion of anti-p53 CD8+ T cells in patients treated with p53MVA and gemcitabine correlates with longer progression free survival (PFS).

PBMC collected from patients pre and post therapy were assessed for p53 reactivity in vitro by 24 hour stimulation with a p53 peptide library or controls (positive control = CMV pp65 peptide, negative control = DMSO only). The T cell activation marker CD137 was used as a measure of T cell reactivity and was quantified by flow cytometry. Panel A shows the FACS plots from Patient 3, the highest immunological responder. Panel B shows the % of p53 reactive CD8+ T cells detected pre and post vaccination in all 11 patients. To control for background reactivity, % CD137+ cells in response to p53 peptide - %CD137+ T cells in the negative control stimulation were plotted. ‘CD8+ responders’ (solid lines) were defined as those showing a rise in p53-reactive CD4+ T cells above baseline, reaching a minimum of 0.5% reactive cells. Patients not reaching this level were defined as ‘CD8+ non-responders’ (broken lines). Panel C shows the patients in each group and with PFS median and range. The accompanying Kaplan Meier curve shows that the difference in PFS between the two groups was statistically significant (p=0.05).
