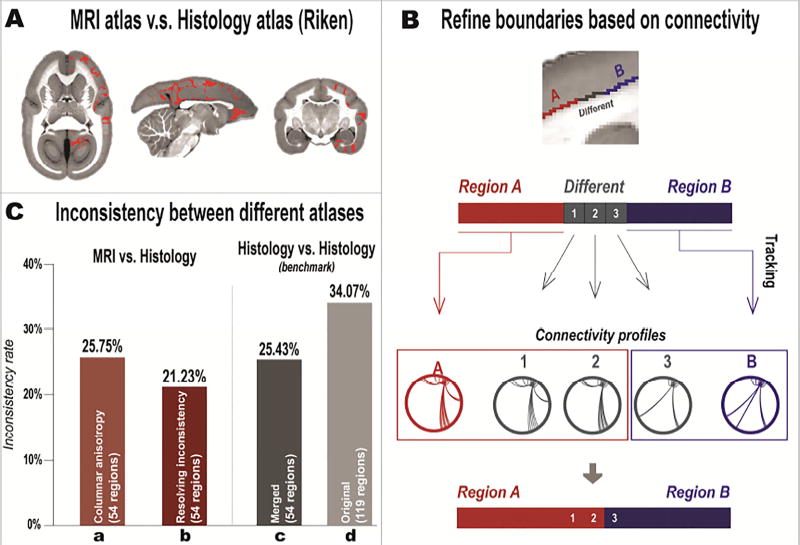
Figure 3. Refining the MRI-based atlas based on its differences from the existing histology-based atlas.
(A) Example of voxels that have different (inconsistent) labels (indicated in red) between the MRI atlas (after the columnar-anisotropy relabeling) and the Riken atlas. (B) Cortical areas that show inconsistencies between atlases were refined based on their connectivity profiles. Regions A (red) and B (blue) represent two adjacent areas that have the same (consistent) labels in both MRI and Riken atlases, while the boundary voxels (gray) represent areas with different (inconsistent) labels in the two atlases. Whole-brain tractography was performed for region A, region B, and for each gray voxel to map their connectivity patterns. The gray voxels were then assigned to either region A or B according to similarities of their connectivity patterns to each of the two regions. (C) Inconsistency rates between different atlases. “MRI vs. Histology” bars show inconsistency rates between the MRI atlas and the merged Riken atlas. “Columnar anisotropy” represents the MRI atlas after relabeling by the columnar anisotropy. “Resolving inconsistency” represents the MRI atlas after refining the cortical boundaries based on their connectivity patterns. “Histology vs. Histology” bars show the inconsistency rate between two histological atlases, the Riken atlas and the Paxinos atlas. “Original” represents the original histology atlases (119 cortical regions). “Merged” represents the histology atlases with the number of regions matched with the MRI atlas (54 cortical regions).

