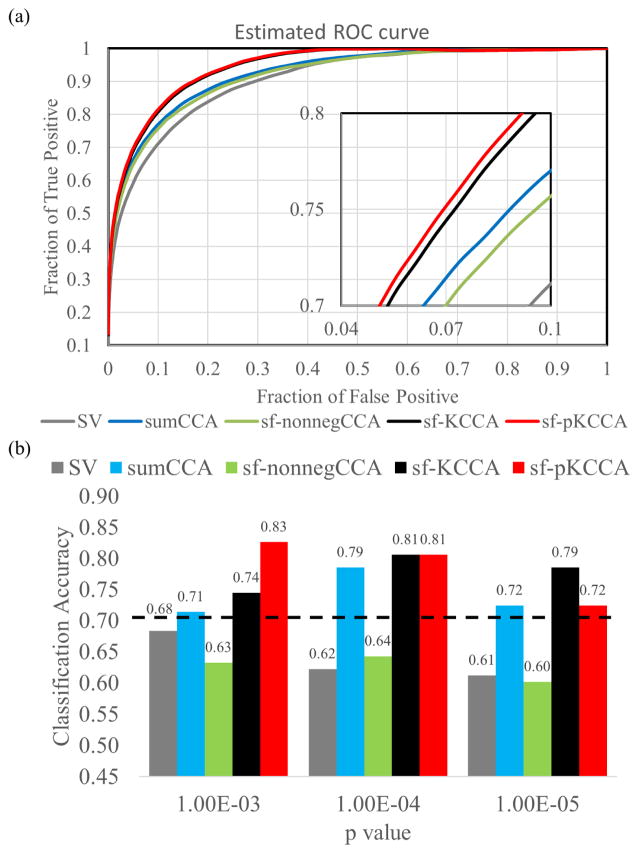
Figure 8.
Estimated ROC curves and prediction accuracy using RBFN machine learning classifier for real fMRI data.
(a) Estimated ROC curves for real fMRI data. (b) Classification accuracy between aMCI subjects and NCs based on activation maps from 5 analysis methods (SV: gray bar; sf-nonnegCCA: green bar; sumCCA: blue bar; sf-KCCA: black bar; sf-pKCCA: red bar) at different p values. By using the leave-2-out cross validation method, a radial basis function network (RBFN) machine-learning technique was used to determine the prediction accuracy using activation maps thresholded at p values of {10−3, 10−4 and 10−5}. The black dashed line is the prediction accuracy corresponding to the 95th percentile of the null distribution.

