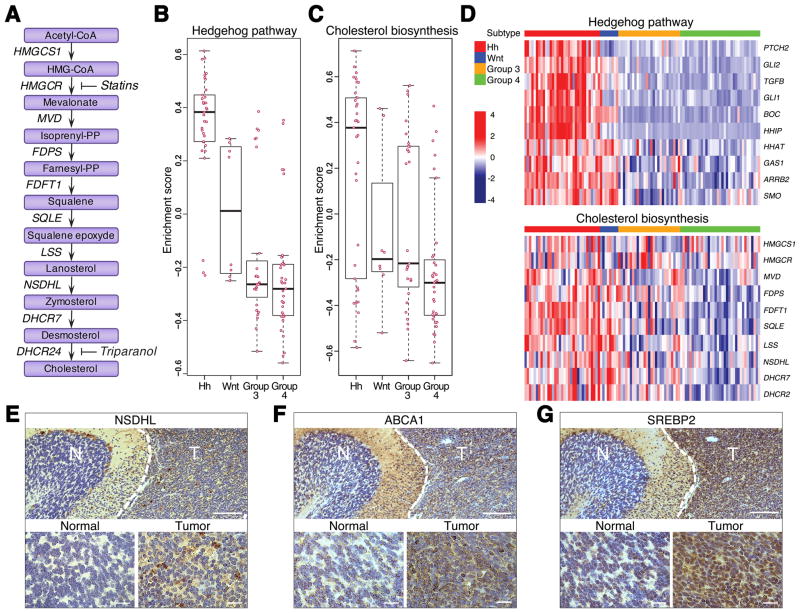
Fig. 1. Cholesterol biosynthesis is enhanced in Hh subtype of MB.
(A) A schematic diagram of cholesterol biosynthesis pathway with genes encoding corresponding enzymes listed along arrows. Enzymes: HMGCS1 3-hydroxy-3-methylglutaryl-CoA synthase 1; HMGCR 3-hydroxy-3-methylglutaryl-CoA reductase; MVD mevalonate diphosphate decarboxylase; FDPS farnesyl diphosphate synthase; FDFT1 farnesyl-diphosphate farnesyltransferase 1; SQLE squalene epoxidase; LSS lanosterol synthase; NSDHL NAD(P) dependent steroid dehydrogenase-like; DHCR7 7-dehydrocholesterol reductase; DHCR24 24-dehydrocholesterol reductase.
Statins inhibit conversion of HMG-CoA to mevalonate through competitive inhibition of HMG-CoA reductase (HMGCR). Triparanol blocks the last step of cholesterol biosynthetic pathway through inhibition of 24-dehydrocholesterol reductase (DHCR24).
(B–C) Box plots showing the enrichment scores from Gene Set Variation Analysis. X and Y-axes illustrate enrichment statistics across 4 different subtypes of MB. Positive and negative scores indicate positive and negative enrichment respectively. Pink dots represent the enrichment score for each sample in that subtype. Black bar in the middle of the box indicates median.
(D) Heat maps showing expression of representative genes in the Hh and cholesterol synthesis pathways. Z-scores calculated for each gene are plotted on a red (higher expression) and blue (low expression) scale. Top color bar indicates the subtype.
(E–G) Immunohistochemical analysis of NSDHL (E), ABCA1 (F) and SREBP2 (G) proteins in mouse Ptch1+/− MB. Normal adjacent tissue represents a cerebellar lobe with differentiated granule neurons used as a control. Scale bars 100 μm, insets 10 μm.

