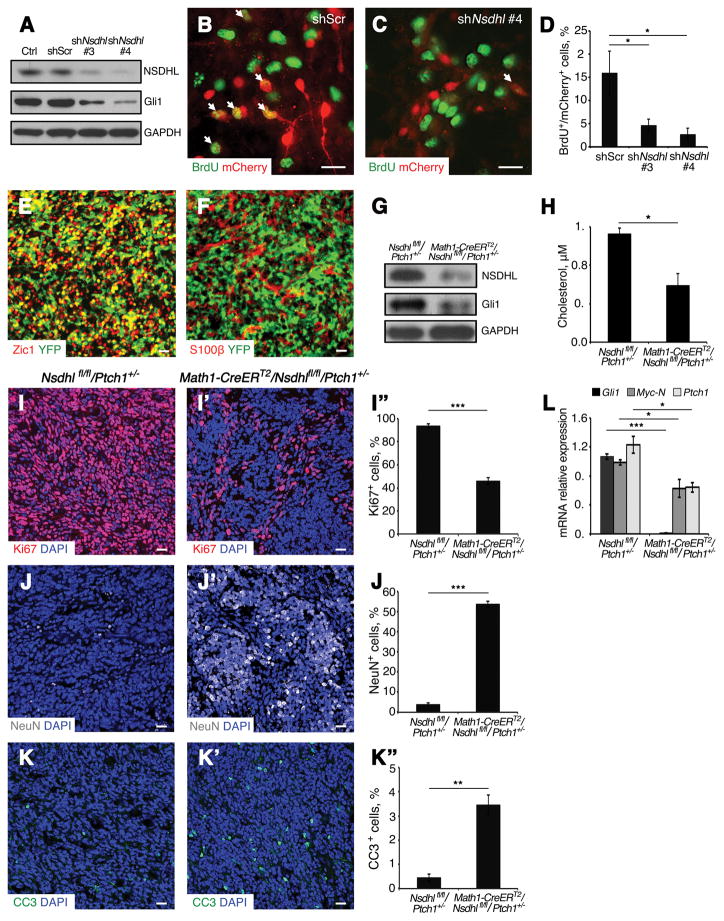
Fig. 2. Deficiency of NSDHL inhibits Ptch1+/− MB cell proliferation.
(A) Western blot analysis of NSDHL and Gli1 proteins expression in Ptch1+/− MB cells following infection with lentivirus carrying Nsdhl shRNA (#3 and #4) or scrambled shRNA and uninfected control after 48 hours in culture. GAPDH was used as a loading control.
(B–C) Immunofluorescence analysis of BrdU among Ptch1+/− MB cells infected with scrambled control shRNA (mCherry+, B) or Nsdhl shRNA #4 (mCherry+, C) after 48 hours in culture.
(D) Percentage of BrdU+ cells in infected MB cells (mCherry+) in Fig. 3B and 3C.
(E–F) Sagittal sections of MB tissue from Math1-CreERT2/R26R-eYFP/Ptch1+/− mice were immunostained against Zic1 and YFP (E), S100β and YFP (F).
(G) Western blot analysis of NSDHL and Gli1 protein expression in MB tissue from Math1-CreERT2/Nsdhl fl/fl/Ptch1+/− and Nsdhlfl/fl/Ptch1+/− mice after tamoxifen treatment. GAPDH was used as a loading control.
(H) Mass-spectrometry analysis of cholesterol content (μM) in MB tissue from Math1-CreERT2/Nsdhl fl/fl/Ptch1+/− mice and Nsdhlfl/fl/Ptch1+/− mice after tamoxifen treatment.
(I–K″) Immunofluorescence analysis of Ki67 (I–I″), NeuN (J–J″) and CC3 (K–K″) in tumor tissue from Nsdhl fl/fl/Ptch1+/− mice (I, J, K), Math1-CreERT2/Nsdhl fl/fl/Ptch1+/− mice (I′, J′, K′) after tamoxifen treatment, and percentage of Ki67, NeuN and CC3 positive cells in above sections respectively (I″, J″, K″). MB tissues were counterstained with DAPI.
(L) qPCR analysis of relative mRNA expression of Hh pathway genes (Gli1, N-Myc, Ptch1) in MB tissue from Math1-CreERT2/Nsdhl fl/fl/Ptch1+/− mice and Nsdhl fl/fl/Ptch1+/− mice after tamoxifen treatment.
Scale bars 10 μm. Significance asterisk key: p value < 0.05 (*), p<0.01 (**), p<0.001 (***), p<0.0001 (****).

