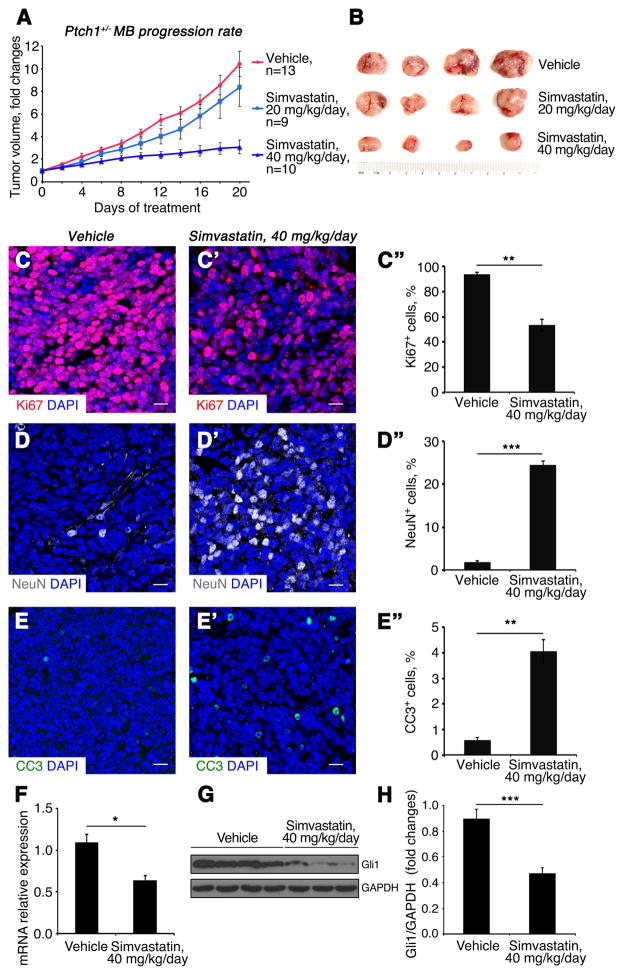
Fig. 5. Simvastatin inhibits growth of Ptch1+/− MB.
(A) Growth rate of subcutaneous Ptch1+/− MB following treatment with simvastatin or vehicle control.
(B) Tumors size of subcutaneous Ptch1+/− MB following drug treatment.
(C–E″) Sections of subcutaneous Ptch1+/− MB after treatment with vehicle (C, D, E) or 40 mg/kg/day simvastatin (C′, D′, E′), were immunostained for Ki67 (C–C″), NeuN (D–D″) or CC3 (E–E″). Percentage of Ki67+ cells (C″), NeuN+ cells (D″) and CC3+ cells (E″) in MB tissue after designated drug treatment. MB tissues were counterstained with DAPI. Scale bars 10 μm.
(F–H) mRNA (F) and protein (G) expression of Gli1 in Ptch1+/− MB tissues after drug treatment, were analyzed by qPCR and western blotting, respectively. (H) Quantification of Gli1 protein expression.
Significance asterisk key: p value < 0.05 (*), p<0.01 (**), p<0.001 (***), p<0.0001 (****).

