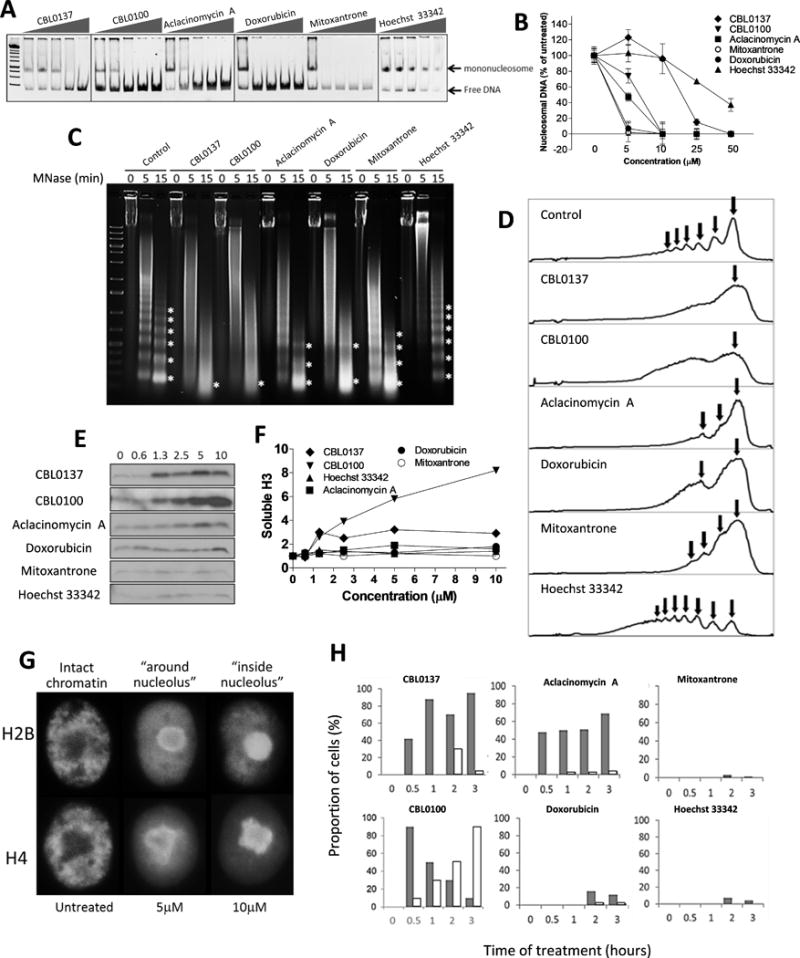
Figure 2.

Effect of the compounds on nucleosome stability. (A-B) Effect of the drugs (0, 5, 10, 25 and 50μM) on the stability of mononucleosome in cell-free conditions upon 15 min incubation at room temperature. Then reaction mixture was run in 5% native polyacrylamide gel. (A) Images of representative runs. (B) Quantitation of several experiments via densitometry of nucleosomal DNA. Mean % of control ± SD. (C-D). Effect of the drugs on the sensitivity of chromatin in HeLa cells to micrococcal nuclease (MNase) digestion. Drugs (100μM, equivalent of 10μM in cell-based experiments based on DNA amount) were incubated for 15 minutes with nuclei of HeLa cells, followed by MNase digestion for 5 or 15 minutes, DNA purification and agarose gel electrophoresis. (C) Images of representative runs. (D) Profiles of light intensity of lanes corresponding to 15 minutes of MNase treatment obtained using Image J. Asterisks on panel C correspond to arrows on panel D and indicate nucleosome protected bands. All direct DNA-binding compounds used in the study are known to inhibit nucleases, including MNase (27), therefore the resulting effect is seen as loss of nucleosome protected bands (effect of the drugs on chromatin) and appearance of higher molecular weight smear (under-digested naked nuclear DNA – effect of the drugs on MNase). Effect of Hoechst 33342 cannot be assessed due to complete inhibition of MNase. We compared the results by examining the loss of a regular nucleosome ladder, rather than by the degree of digestion. (E, F) Effect of the compounds on the distribution of histones in cells. (E) Immunoblotting of soluble protein extracts of HeLa cells treated with the indicated doses of the compounds for 1.5 hours and probed with antibody to histone H3. (F) Quantitation of data shown in E. (G) Accumulation of mCherry-tagged histone H2B and mOrange-tagged histone H4 around (CBL0137, 5μM) and inside nucleoli (CBL0137, 10μM). HeLa cells were treated for 1 hour. (H) Quantitation of histones H2B eviction from chromatin in HeLa cells treated with 10μM of different drugs, for the indicated periods of time. Grey bars – proportion of cells with histones around nucleoli, white bars – inside nucleoli. Similar data for histone H4 is shown in Supplementary Figure S14.
