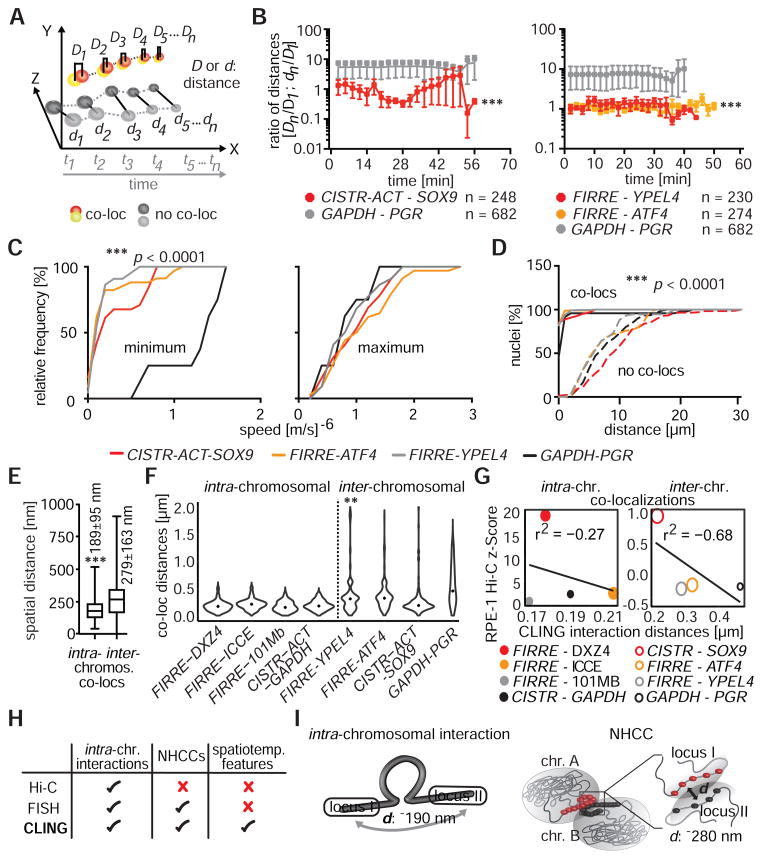
Figure 2. NHCC dynamics.
(A) Distances (D, d) between co-localized signals were measured and compared to non-co-localized signals over time (t) in 4D-CLING. (B) The ratios of distances (Dn or dn/D1, see panel A), determined that co-localized signals were closer to each other than GAPDH and PGR, and they remained associated over time (*** p < 0.0001, Mann-Whitney rank-sum test, means±SEM). (C) Speed measurements (m/s)−6 separated in minimum and maximum of time-matched 4D-data. At low speeds, all loci were less mobile than the control loci GAPDH and PGR (*** p < 0.0001, Mann-Whitney rank sum test). (D) Spatial distances between co-localized and non-co-localized signals (*** p < 0.0001, Mann-Whitney rank sum test). (E) Distances between co-localized loci of intra- or inter-chromosomal interactions in RPE-1 nuclei (*** p < 0.0001, Mann-Whitney rank sum test, without outlier). (F) Distributions of co-localization distances of intra- or inter-chromosomal interactions were mostly unimodal, whilst was FIRRE-YPEL4 distances were bimodal (Hartigan’s dip test, ** p < 0.001, black dots = medians). (G) Spearman correlations between intra- (bin size = 100 kb) or inter-chromosomal (bin size = 500 kb) CLING spatial distances, CLING co-localization frequencies (size of data points indicates co-localization frequencies in %), and Hi-C interaction probabilities (z-scores) in RPE-1 Hi-C. Smaller spatial distances correlate with higher Hi-C z-scores. (H) Discrepancies between imaging and Hi-C methodologies. (I) Schemes of spatial organization of two given loci in intra-chromosomal interactions and NHCCs (d = distance)

