
Figure 2.
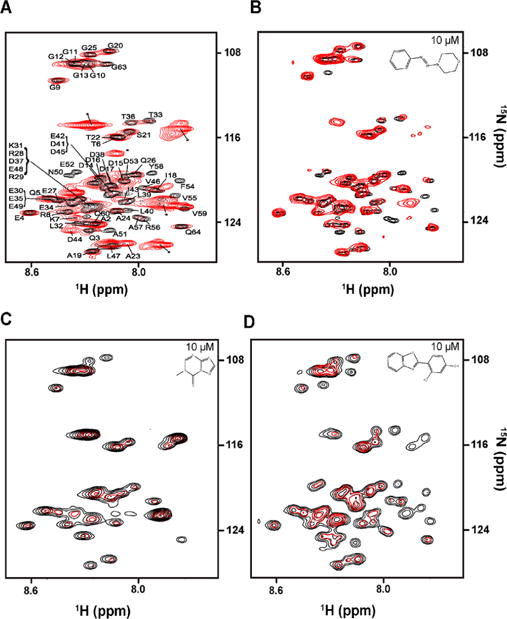
Screening by in-cell STINT-NMR. (A) Overlay of in-cell 1H–15N HSQC spectra of [U-15N]Pup overexpressed for 2 h (black) and [U-15N]Pup–Mpa complex (red) following 8 h of Mpa overexpression. Peaks labeled with an asterisk are metabolites. (B) Overlay of in-cell 1H–15N HSQC spectra of the [U-15N]Pup–Mpa complex containing 0.1% v/v DMSO (black) and 10 μM MTBA (red). (C) Overlay of in-cell 1H–15N HSQC spectra of the [U-15N]Pup–Mpa complex containing 0.1% v/v DMSO (black) and 10 μM MTBB (red). (D) Overlay of in-cell 1H–15N HSQC spectra of the [U-15N]Pup–Mpa complex containing 0.1% v/v DMSO (black) and 10 μM MTBC (red).