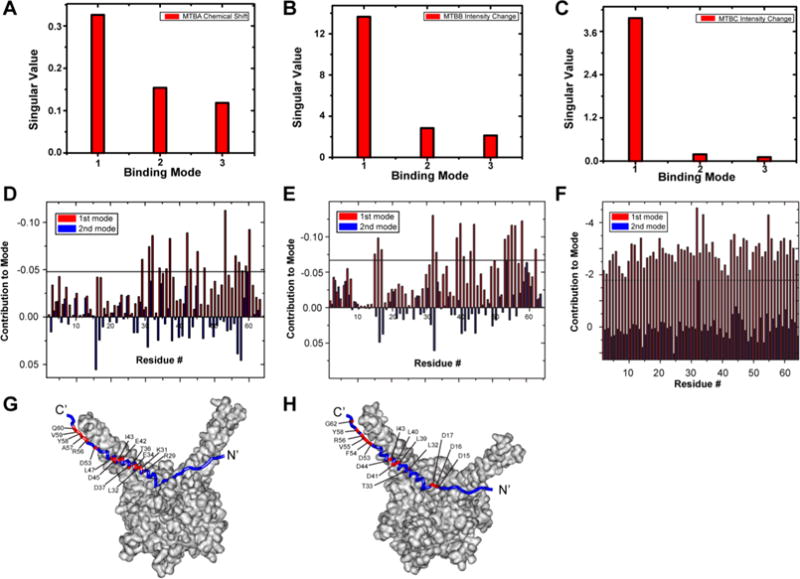
Figure 3.

SVD analysis of selected compounds identify Pup residues involved in small molecule binding. (A, B, C) Scree plots of SVD analysis of matrices of change in [U-15N]-Pup chemical shifts due to MTBA (A), changes in [U-15N]-Pup peak intensities due to MTBB (B), and changes in peak intensities due to MTBC (C). (D, E, F) The weighted contribution of each Pup residue to the first (red) and second (blue) binding modes in response to MTBA (D), MTBB (E), and MTBC (F). There are two bars per residue. The largest weighted contribution from the second binding mode was used as a threshold to highlight the amino acids most strongly implicated in the binding. (G, H) Pup residues involved in MTBA (G) and MTBB (H) (red) binding are mapped onto the Pup–Mpa complex. Some labeled residues are obscured due to image orientation. The Pup–Mpa structure (PDB code 3M9D) was constructed by using Accelrys Discovery Studio 2.5.
