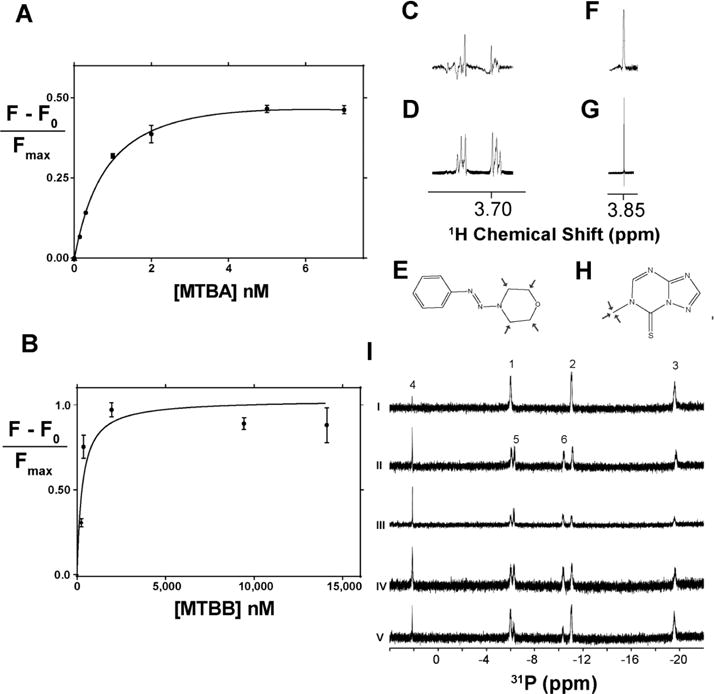
Figure 6.

Binding properties of selected compounds. (A, B) Binding isotherms for MTBA (top) and MTBB (bottom) generated from tryptophan fluorescent titrations of Mpa. Dissociation constants were resolved for MTBA, 1.0 +/− 0.1 nM (R2 = 0.99), and MTBB, 0.4 ± 0.1 μM (R2 = 0.92). (C) STD NMR spectral peak of 100 μM MTBA with 10 μM Mpa showing saturation of the morpholine ring signal at 3.7 ppm. (D) 1H peak arising from the morpholine ring of MTBA. (E) Structure of MTBA with arrows highlighting the binding epitope, as determined by STD NMR. (F) STD NMR spectral peak of 100 μM MTBB with 10 μM Mpa showing saturation of the methyl group signal at 3.85 ppm. (G) 1H peak arising from the methyl group of MTBB. (H) Structure of MTBB with arrows highlighting the binding epitope, as determined by STD NMR. Due to extreme hydrophobicity, MTBC was not titrated. (I)31P NMR ATPase assay shows that selected compounds do not inhibit ATP hydrolysis. 1, 2, and 3 refer to γ-, α-, and β-ATP phosphates, respectively, and 4 is an inorganic phosphate signal. Upon hydrolysis, β- and α-ADP phosphate signals, 5 and 6, respectively, arise as ATP is hydrolyzed. (i) ATP in ATPase buffer; (ii) ATP and Mpa,; (iii) Mpa, ATP, and 100 μM MTBA; (iv) Mpa, ATP, and 100 μM MTBB; (v) Mpa, ATP, and 100 μM MTBC.
