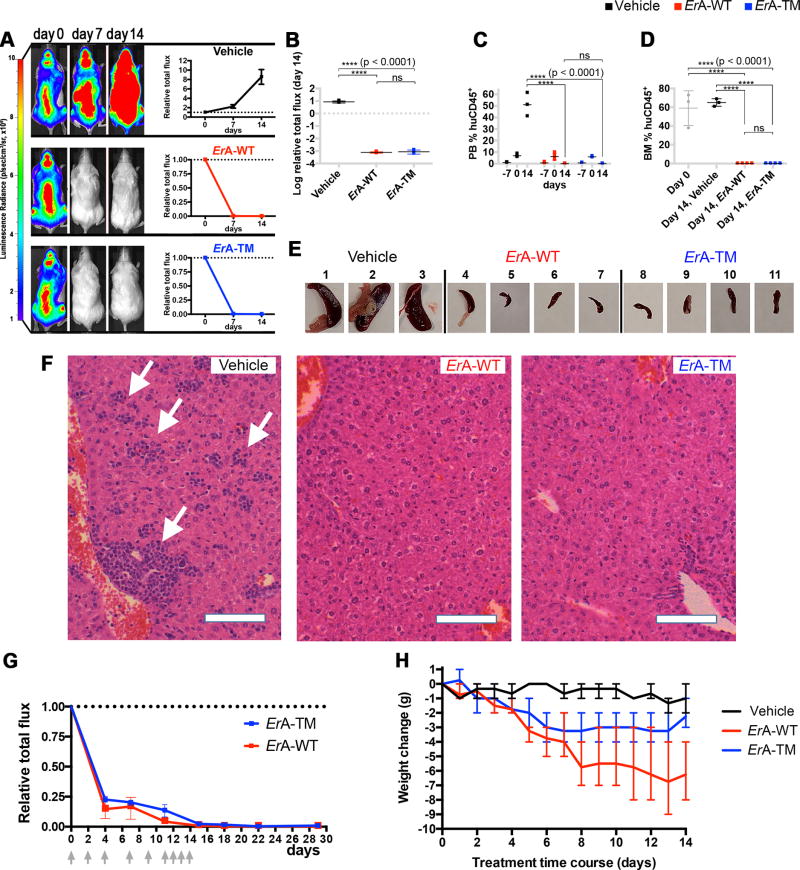
Fig. 2. The low L-glutaminase ErA-TM eliminates T-ALL LOUCY cells as effectively as the high L-glutaminase ErA-WT and with reduced toxicity.
(A) Female mice tail vein-injected with luciferase-expressing LOUCY cells four weeks prior were treated daily with vehicle (n=3); ErA-WT (n=4); and ErA-TM (n=4) for 14 days (drug dose 50 IU/mouse/day; i.p.). For each group, the representative animal shown had the highest BLI signal at day 0 of treatment. BLIs from all animals are presented in Supplementary Fig. 4 and 6. The average BLI signal of each group at day 7 and 14 relative to the value at day 0 (day 0 = 1) was plotted with mean and standard deviation (SD). See Supplementary Biostatistics on imaging for detailed standard error analysis. (B) Relative BLI flux at day 14 between the vehicle, ErA-WT, and ErA-TM groups. The flux for the vehicle mice increased 10-fold relative to day 0. For both treated groups, the flux decreased dramatically relative to vehicle control (p-value <0.0001), returning to background levels by day 14, with no significant (ns) difference between the treated groups. Mean with SD were plotted. See Supplementary Biostatistics on imaging for detailed standard error analysis. (C) PB %huDC45+ levels were determined one week prior to treatment initiation (day -7), at treatment start (day 0), and at end of treatment (day 14). At day 0, all animals were highly engrafted, as indicated by %huCD45+ >8%. By day 14, for the vehicle-treated mice, the %huDC45+ increased to 40–60%, whereas for both treatment groups, the %huCD45+ was undetectable (p-value <0.0001 between vehicle- and enzyme-treated groups; ns between the two enzyme-treated groups). Mean with SD were plotted. All tests were set at controlling for probability of Type I error of 0.05. See Supplementary Biostatistics for more details. (D) At day 0, assessment of BM %huDC45+ in 3 mice with similar BLI flux as the ones used for treatment revealed high engraftment (gray boxes). At day 14, BM %huDC45+ remained high in the vehicle-treated mice, but was undetectable in both enzyme-treated groups (p-value <0.0001 between vehicle- and enzyme-treated groups; ns between the two enzyme-treated groups). Mean with SD were plotted. All tests were set at controlling for probability of Type I error of 0.05. See Supplementary Biostatistics for more details. (E) Spleens from the vehicle-treated mice were highly enlarged, whereas spleens from the ErA-WT and ErA-TM groups resembled normal mouse spleens in size. (F) H&E-stained paraffin sections of livers from vehicle-, ErA-WT- and ErA-TM-treated mice. Vehicle-treated animals had livers filled with deposits of lymphoblastic leukemic cells (arrows). In contrast, livers of mice treated with ErA-WT or ErA-TM had no detectable leukemic cells present; bar = 10 µm. (G) Female mice tail vein-injected with luciferase-expressing LOUCY cells four weeks prior were treated i.p. with ErA-WT (n=3); and ErA-TM (n=3) for 14 days (a total of 9 drug doses of 25 IU/mouse on days indicated by gray arrows). The average BLI (+SD) signal of each group at day 0, 4, 7, 11, 15, 18, 22 and 29 relative to the value at day 0 (day 0 = 1) is plotted. (H) Correlation between L-glutaminase activity and toxicity of the ErA variants. Weight loss (in grams, relative to day 0), an indicator of toxicity, was monitored in mice treated with vehicle (black trace), ErA-WT (red trace, L-glutaminase@Gln500µM=15.87 sec−1) and ErA-TM (blue trace, Gln500µM=0.01 sec−1). The pronounced daily weight loss in the ErA-WT-treated group is ameliorated in the ErA-TM-treated group by 0.29 g/day, p-value <0.0001.

