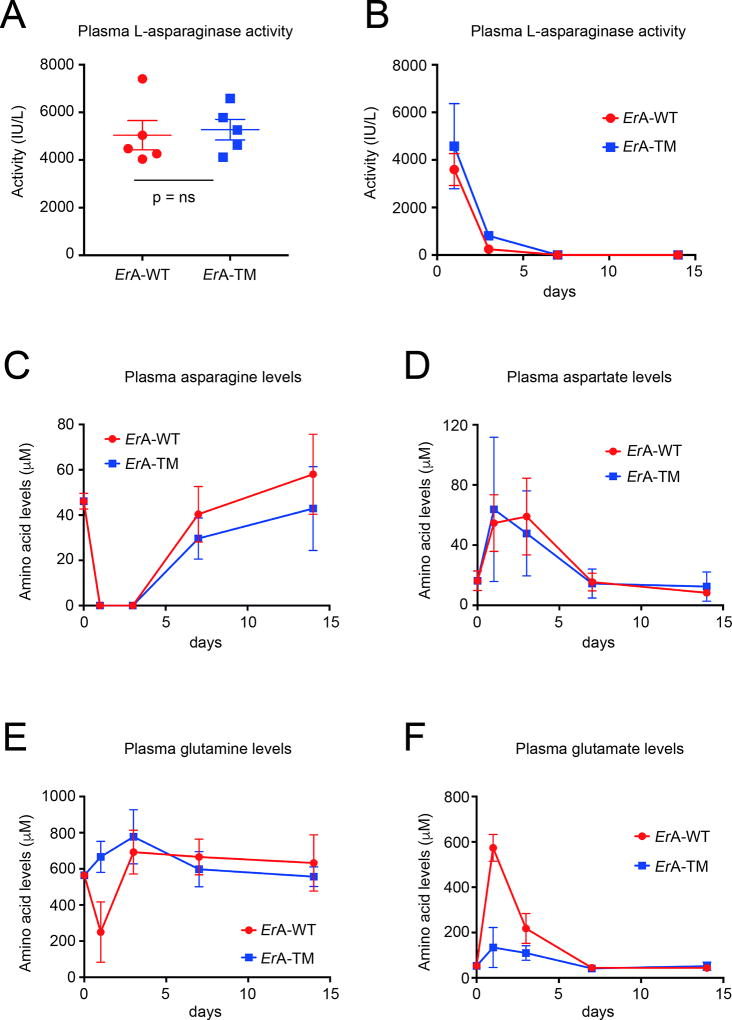
Fig. 3. Similar in vivo stability for ErA-WT and ErA-TM and ability to deplete blood asparagine but dissimilar impact on glutamine homeostasis.
(A) L-asparaginase activity measurement in blood plasma samples of mice obtained 24 h after injection of 50 IU of ErA-WT or ErA-TM from batch #1. Mean with SEM (standard error of the mean) is shown for each group and non-parametric Mann-Whitney test was used for statistics. (B) L-asparaginase activity measurement in blood plasma samples of mice obtained 1, 3, 7 and 14 days after injection of 50 IU of ErA-WT or ErA-TM from batch #2. (C) Determination of asparagine levels in blood plasma samples of mice prior to the treatment and at days 1, 3, 7 and 14 post administration of ErA-WT or ErA-TM. For each time point, the mean and standard deviation are shown. (D) Determination of aspartate levels in blood serum samples of mice prior to the treatment and at days 1, 3, 7 and 14 post administration of ErA-WT or ErA-TM. For each time point, the mean and standard deviation are shown. (E) Determination of glutamine levels in blood plasma samples of mice prior to the treatment and at days 1, 3, 7 and 14 post administration of ErA-WT or ErA-TM. For each time point, the mean and standard deviation are shown. (F) Determination of glutamate levels in blood plasma samples of mice prior to the treatment and at days 1, 3, 7 and 14 post administration of ErA-WT or ErA-TM. For each time point, the mean and standard deviation are shown.

