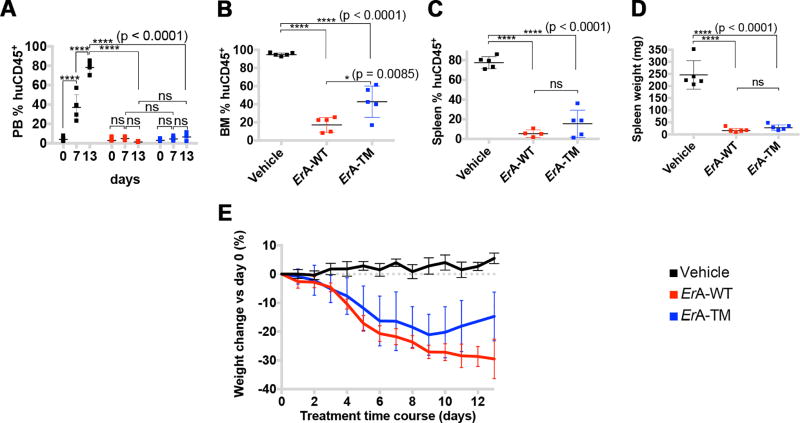
Fig. 4. In a T-ALL PDX model, ErA-TM displays similar cell killing combined with reduced toxicity compared to ErA-WT.
Female mice injected with primary T-ALL cells five weeks prior were treated daily with vehicle; ErA-WT or ErA-TM (n=5 for each group) for 13 days (drug dose 50 IU/mouse/day; i.p.). Cell debris and duplicates were gated out during flow cytometry data analysis. (A) PB %huCD45+ levels were determined once every week and at day 0, all animals were engrafted, as indicated by %huCD45+ ~4%. For the vehicle-treated mice, the %huCD45+ increased to ~40% by day 7 and ~80% by day 13, whereas for both treatment groups, the %huCD45+ stayed statistically indifferent to day 0 (p-value >0.2). No difference was detected between the two enzyme-treated groups at day 7 and day 13 (p-value >0.6). The %huCD45+ levels could not be analyzed for one mouse in the ErA-WT group and for one mouse treated with ErA-TM due to bad sample quality. (B) Similar to panel A, but for the BM at day 13. Whereas the BM of the vehicle group was full of cancer cells with %huCD45+ ~95%, the disease was largely controlled in the two enzyme-treated groups with %huCD45+ ~20 – 40%. (C) Similar to panel B, but for the spleen at day 13. The analysis of spleen sample of mouse 18 (ErA-WT-treated) was not included because of bad sample quality. Whereas the vehicle-treated group’s spleens were ~80% invaded with cancer cells, less than 20% of %huCD45+ was detected in the enzyme-treated groups. No significant difference was detected between the ErA-WT- and ErA-TM-treated groups (p-value ~0.2). (D) On sacrifice, spleens were harvested and weighed. Shown are the spleen weights for the 3 groups. Consistent with the cancer cell invasion data in panel C, the weight of spleens from the vehicle-treated group are significantly higher than the enzyme-treated groups, but no significant difference was detected between the two enzyme-treated groups (p-value >0.8). (E) Mice weight change, shown as % change relative to day 0, over the course of the 13-day treatment period is shown. On average, at day 13, ErA-WT- treated mice lost ~30% of body weight, whereas ErA-TM- treated mice lost ~15% (p-value <0.05). n.s. = not significant. In all panels, the color code depicting the vehicle-treated group, the ErA-WT- treated group and the ErA-TM- treated group is black, red and blue, respectively. Mean with SD were plotted.

