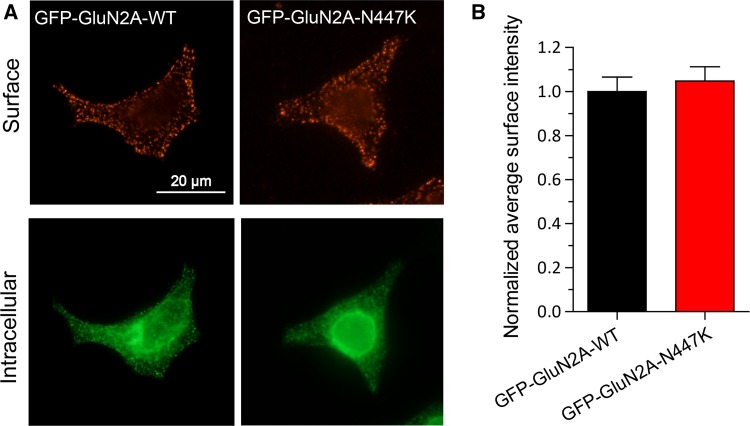
Fig. 4.
Surface expression of wild-type and mutant NMDARs. A Representative images of surface (red, upper row) and intracellular (green, lower row) expression of GluN1/GluN2A-WT or GluN1/GluN2A-N447K NMDARs in HEK 293 cells (scale bar, 20 μm). B Summary data showing that the mutant and wild-type NMDARs have similar surface expression levels.

