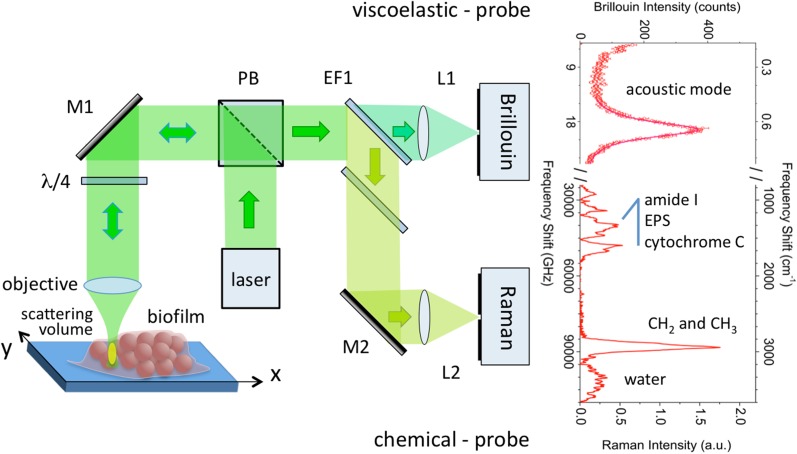
Fig. 2.
Schematic of the set-up for Brillouin-Raman micro spectroscopy measurements [26], with (right side) typical Brillouin and Raman spectra from one single point of the microfilm. Light from a laser source is reflected by a polarizing beam splitter (PB) into a ×50 microscope objective lens and focused though a ~ 1 μm × 1 μm area of the sample. The light back-scattered by the (few micrometers thick) scattering volume is split by an edge filter (EF1), the high-frequency-shift component is sent to the Raman monochromator and the low-frequency shift is sent to the Fabry–Perot interferometer. The sample is mounted on top of a xyz translation stage for 1- and 2-D mapping of the mechanical and chemical properties of the sample. 3-D mapping is also possible, in the case of transparent samples. More details are reported in Ref. [26]

