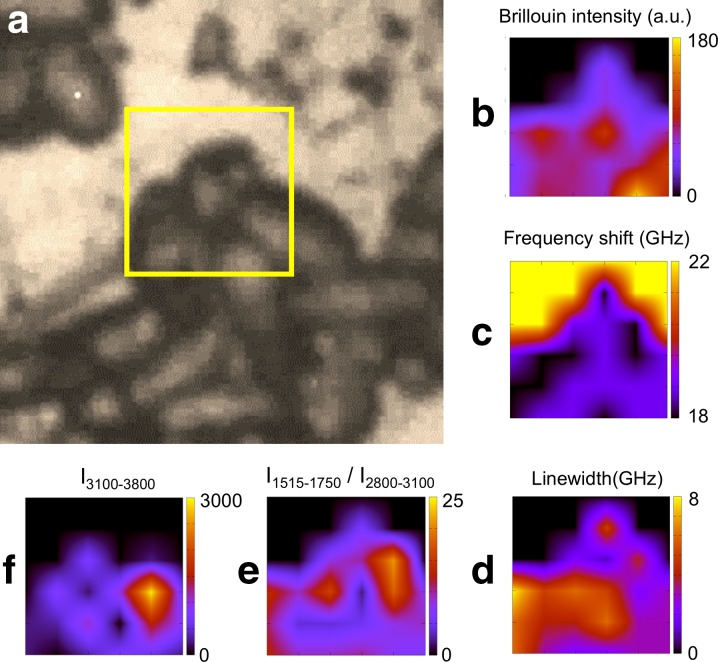
Fig. 4.
Photomicrograph and results of the analysis of Brillouin and Raman spectra of C. parapsilosis grown on stainless steel. a Yellow box a 6 μm × 6 μm region where Brillouin and Raman spectra were collected, using a 1-μm step-size in both directions. b Brillouin intensity, I0, c frequency shift and d linewidth. Raman integrated intensity: e of amide I + EPS constituents + cytochrome c (1515–1750 cm−1) and f of the OH region (3100–3800 cm−1)

