Figure 1.
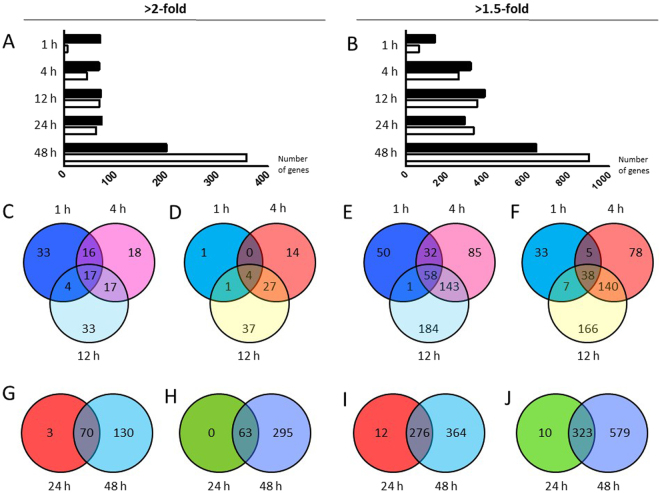
Differentially expressed genes in stretched neonatal rat ventricular myocytes. (A,B) Numbers of differentially expressed genes in response to 1–48 hours of cyclic mechanical stretch in cultured cardiac myocytes with (A) 2-fold difference and (B) 1.5 fold difference. Black columns, upregulated genes; white columns downregulated genes, n = 5 in all groups. (C–I) Venn diagrams indicate the overlap of the genes that were significantly (C) upregulated (>2-fold) or (D) downregulated (<2-fold) and (E) upregulated (>1.5-fold) or (F) downregulated (<1.5-fold) after 1, 4 or 12 hours of stretch as compared to controls. A Venn diagram indicating the overlap of the genes that were significantly (G) upregulated (>2-fold) or (H) downregulated (<2-fold) and (I) upregulated (>1.5-fold) or (J) downregulated (<1.5-fold) after 24 or 48 hours of stretch compared to controls.

