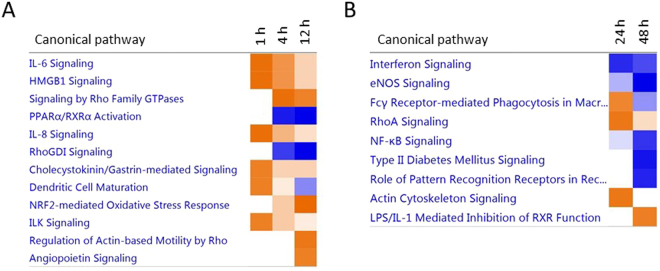
Figure 4.
Significant canonical pathways associated with differentially expressed genes in stretched neonatal ventricular myocytes. Ingenuity pathway analysis showing the canonical pathways that were most significant in the data sets of differentially expressed genes after (A) 1–12 and (B) 24–48 hours of mechanical stretch in cardiac myocytes. The entries that have a −log (p-value) greater than 1.3 and an absolute z-score value greater than 2 are displayed. Colors of the bars in the chart indicate their activation z-scores: orange, overall increase in the activity of the pathway; blue, decrease in activity. The intensity of the color indicates the degree of increase or decrease.

