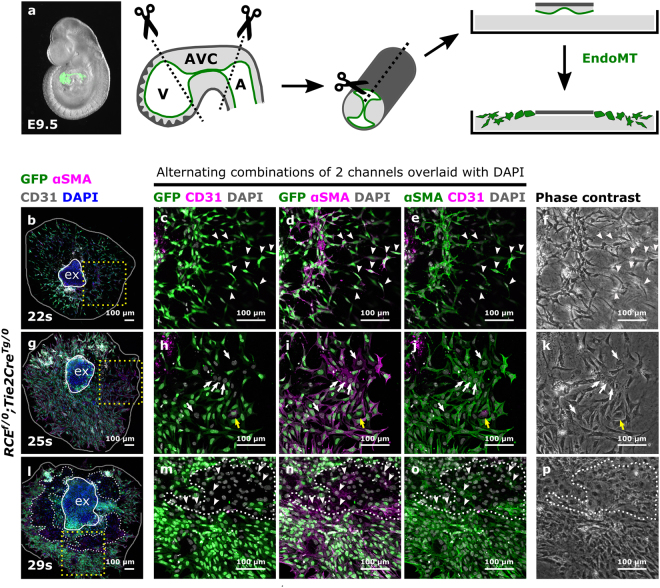
Figure 1.
The cellular outgrowth pattern in mouse AVC explants differs depending on the somite-stage of the embryo. (a) Schematic representation of the mouse AVC explant assay. The endocardium from an E9.5 embryo is highlighted in green. The AVC is marked by the “kissing zone” and the cushions. (b–p) AVCs collected from RCEf/0;Tie2CreTg/0 embryos staged between 22 s–34 s were cultured for 48 h, immunostained for GFP, αSMA and CD31 and imaged by confocal microscopy (N = 19 explants). Boxed areas in (b), (g) and (l) are magnified in respectively (c–e), (h–j) and (m–o) and presented as alternating combinations of two channels in magenta and green, overlaid with DAPI in gray. Individual confocal Z-planes are compared with the corresponding phase contrast images (f,k and p). The explant (ex) is delineated by a white loop. The area of cellular outgrowth in panels (b), (g) and (l) is delineated by a gray loop. White dashes in panels (l–p) indicate GFP-negative monolayers. White arrowheads in panels (c–f) indicate αSMA+GFP+CD31− spindle-like shaped mesenchymal cells. White arrowheads in panels (m–o) indicate αSMA+GFP-CD31− cobblestone-shaped cells. The yellow arrows in panels (h–j) indicate an αSMA+GFP+CD31+ endothelial cell. The white arrows in panels (h–j) indicate αSMA+GFP-CD31- cobblestone-shaped cells. A: atrium, AVC: atrioventricular canal, EndoMT: endothelial-to-mesenchymal transition, V: ventricle.

