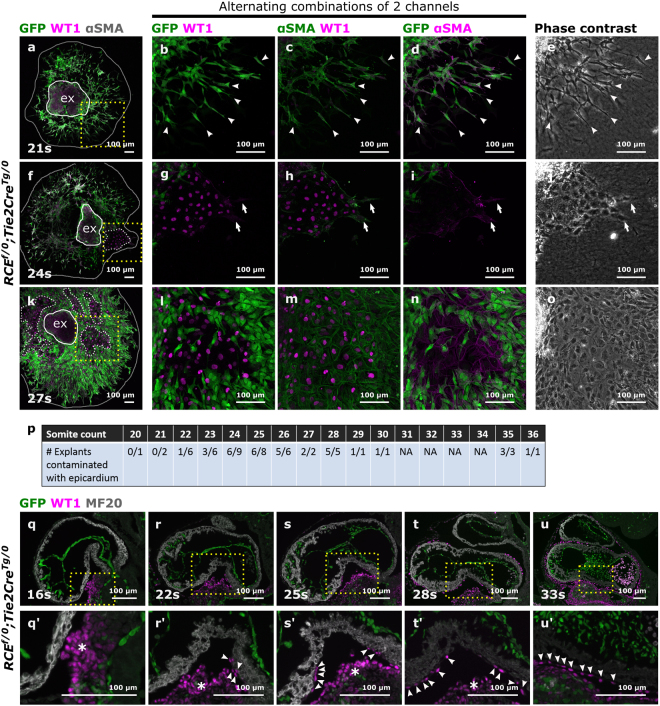
Figure 2.
Epicardial cells contaminate the AVC explant with increasing somite stage which corresponds with the progressive covering of the myocardial wall by epicardial cells. (a–o) AVCs collected from RCEf/0;Tie2CreTg/0 embryos staged between 20 s–36 s (N = 53 explants) were cultured for 48 h and stained for GFP, WT1 and αSMA. Boxed areas in (a), (f) and (k) are magnified in respectively (b–d), (g–i) and (l–n) and presented as alternating combination of 2 channels in magenta and green. Individual confocal Z-planes are compared with the corresponding phase contrast images (e, j and o). The explant (ex) is delineated by a white loop. The area of cellular outgrowth in panels (a), (f) and (k) is delineated by a gray loop. Arrowheads in panels (b–e) indicate αSMA+GFP+WT1− spindle-like shaped mesenchymal cells. Arrows in panels (g–j) indicate epicardial cells undergoing EpiMT. (p) Table representing the numbers of explants isolated per somite stage and the number of explants contaminated with epicardium. NA: not applicable, not dissected in this experiment. (q–u) Parasagittal sections from mouse embryos collected between 16 s–35 s (N = 24 embryos) were stained for GFP, WT1 and MF20. Boxed areas are magnified in (q’-u’). Arrowheads in panels (q’-u’) indicate epicardial cells migrating along the myocardial wall. Asterisks indicate the pro-epicardial organ.

