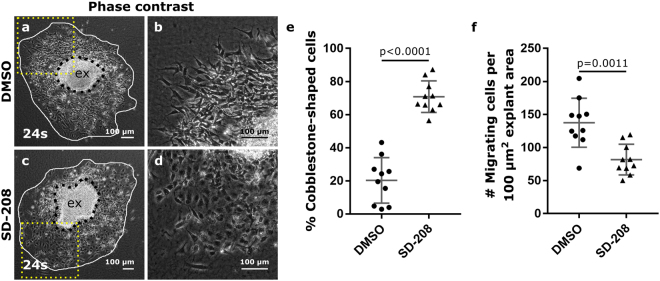
Figure 3.
Inhibition of ALK5 leads to an enrichment in cobblestone-shaped cells. Phase contrast figures of control DMSO (a,b) and SD-208 (c,d) treated explants. Boxed areas in panels (a) and (c) are magnified in panels (b) and (d) respectively. (e) Quantification of the relative amount of cobblestone-shaped cells in the outgrowths. (f) The total number of migrating cells normalized to the explant area (presented per 100 µm2 explant area). The individual datapoints, the mean and standard deviation are presented in panels (e) and (f). The explants (ex) is delineated by black dashes. The area of cellular outgrowth is delineated by a white loop.

