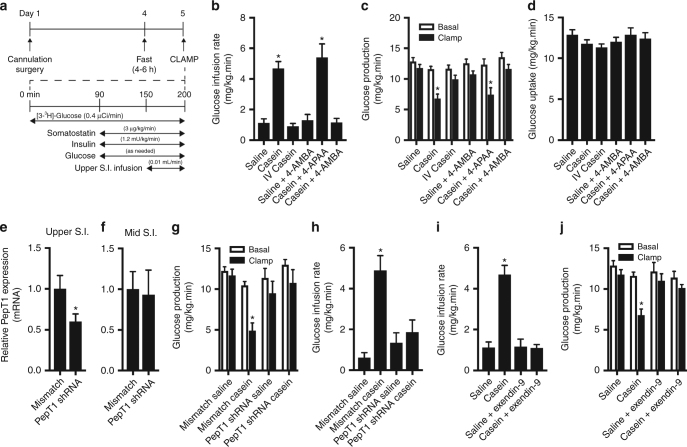
Fig. 3.
Upper small intestinal casein infusion lowers glucose production through activation of PepT1 in healthy rodents. In vivo glucose kinetics were assessed in conscious, unrestrained healthy rats using the pancreatic (basal insulin) euglycemic clamp as outlined in a. Rates of glucose infusion (b), glucose production (GP, c), and glucose uptake (d) in rats that received an upper small intestinal (S.I). infusion of saline (n = 10) or casein (n = 9), intravenous (IV) infusion of casein (n = 5), upper small intestinal infusion of saline+4-AMBA (n = 6), casein+4-APAA (n = 5), or casein+4-AMBA (n = 6). Relative PepT1 mRNA expression in the mucosal layer isolated from S.I. segments ~6–10 cm (upper S.I., e) or ~25–30 cm (mid-S.I., f) distal to the pyloric sphincter in rats that received an upper S.I. lentiviral infection with control mismatch (n = 6) or PepT1 shRNA (n = 6) particles. Rates of glucose production (g) and glucose infusion (h) in rats that received mismatch shRNA lentiviral infection+saline infusion (n = 6), mismatch+casein infusion (n = 6), PepT1 shRNA lentiviral infection+saline infusion (n = 5), or PepT1 shRNA+casein infusion (n = 6). Rates of glucose infusion (i) and glucose production (j) in rats that received saline+the GLP-1 receptor antagonist exendin-9 (n = 3) or casein+exendin-9 (n = 6). Values are presented as mean ± s.e.m., where basal represents the average GP of t = 60–90, clamp represents the average GP of t = 190–200 and asterisk (*) represents p < 0.05 compared to saline control. Statistical significance was determined using an unpaired, two-tailed t-test (two groups) or ANOVA with Tukey post-hoc test (3+ groups)

