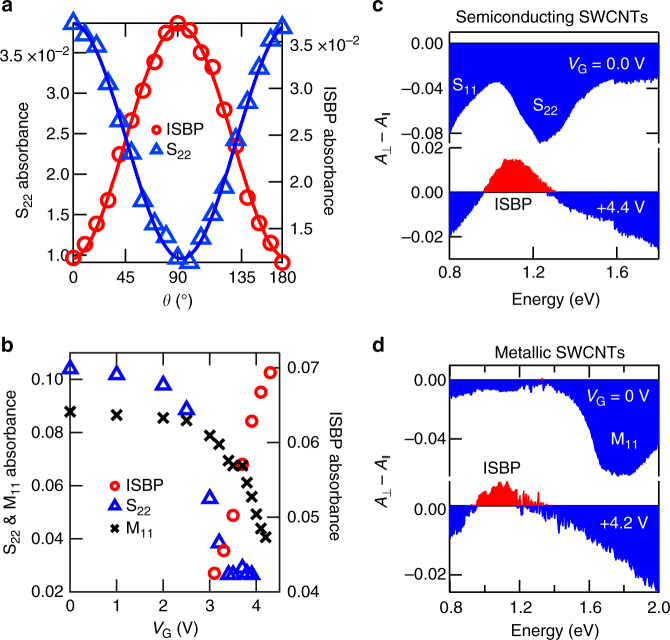
Fig. 3.
Opposite polarization and gate voltage dependence between the interband (S22 and M11) and intersubband (ISBP) absorption peaks. a Peak absorbance of the S22 peak (blue open triangles) and the ISBP peak (red open circles) as a function of polarization angle θ. The solid lines are sinusoidal fits to the data. b Peak absorbance of the S22 peak (blue open triangles), the M11 peak (black multiplication signs), and the ISBP peak (red open circles) as a function of gate voltage. Linear dichroism spectra for aligned c semiconducting and d metallic SWCNTs with an average diameter of 1.4 nm at various gate voltages. The S11, S22, and M11 peaks have negative (blue) signals whereas the ISBP appears as a positive (red) peak

