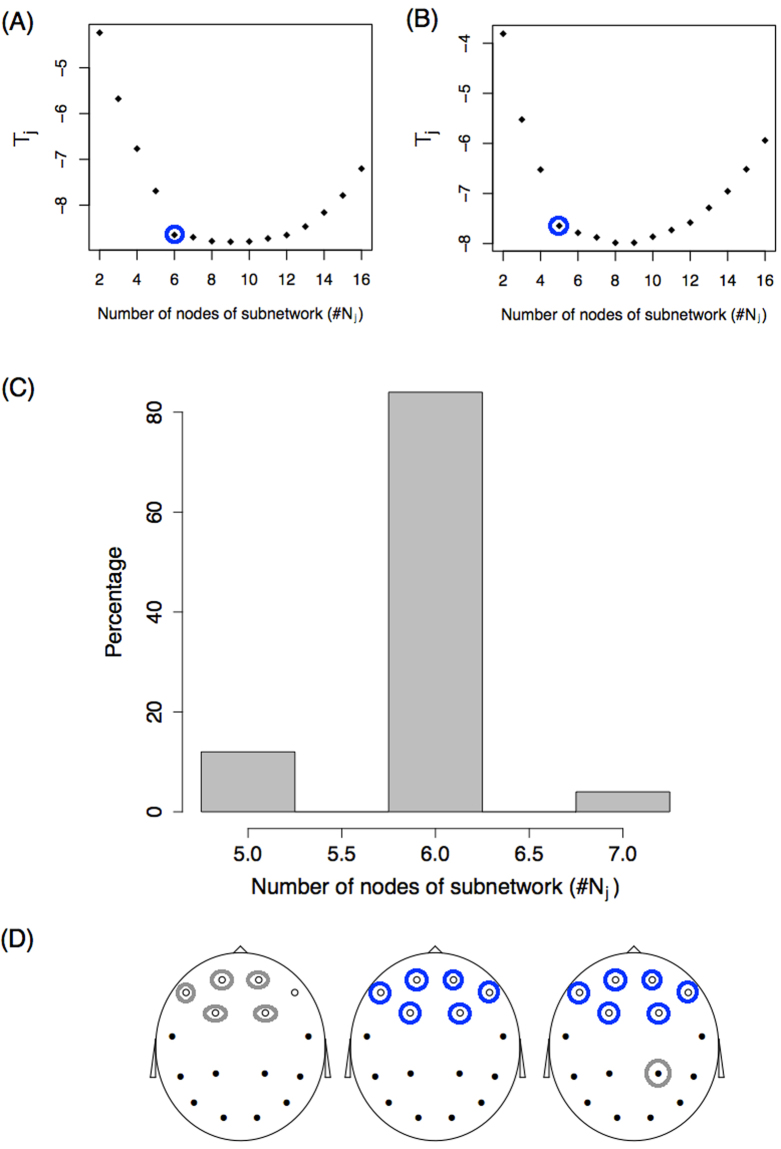
Figure 3.
Identification problem. (A,B) Statistic Tj as a function of the number of nodes of the subnetwork (j) for two simulations. Blue circles represent the value following the criteria described in the text. (C) Histogram of the number of subnetwork nodes showing differences, . (D) Identification of the nodes. Blue and grey circles represent the nodes identified from the set . Circled blue nodes are those identified 100% of the time. Grey circles represent nodes that are identified some of the time. On the left, grey circles alternate between the six white nodes. On the right, the grey circle alternates between the black nodes.

