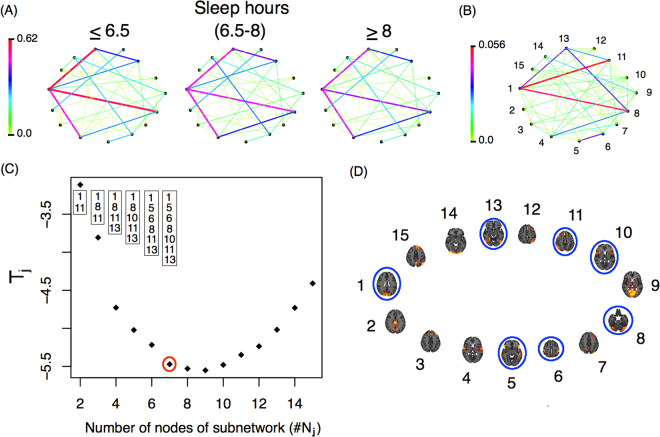
Figure 6.
(A) Average network for each subgroup defined by hours of sleep (B) Weighted network with links that represent the differences among the subpopulation mean networks. (C) Tj-statistic as a function of the number of nodes in each subnetwork (j). The nodes identified by the minimum Tj are presented in the boxes, while the number of nodes identified by the procedure are represented with a red circle. (D) Nodes from the identified subnetwork are circled in blue. The nodes identified in (D) correspond to those in panel (B).

