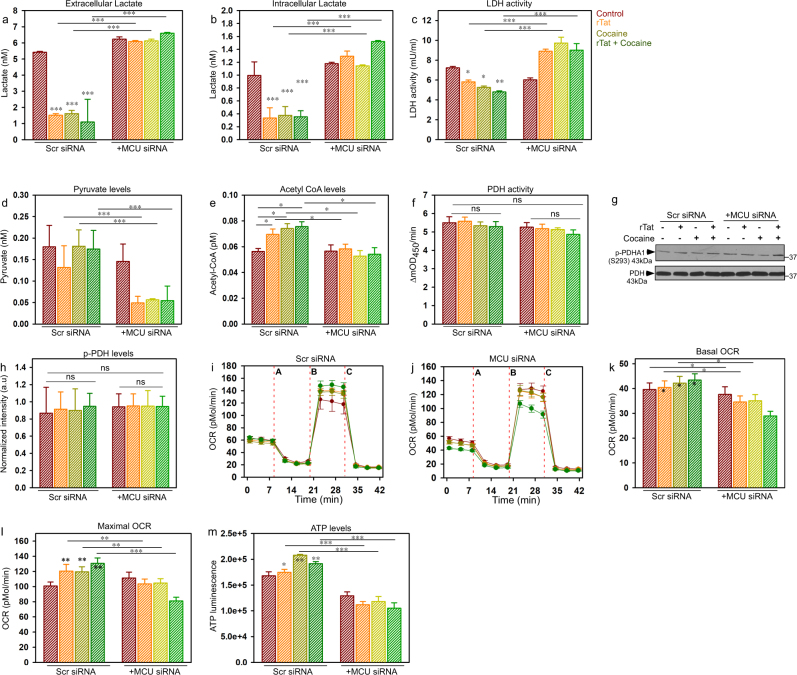
Fig. 3. Knock down of MCU switches astrocytes treated with rTat/cocaine to utilization of fatty acids and facilitates glucose oxidation.
a Quantification of extracellular lactate levels in control (Scr siRNA) and MCU KD astrocytes exposed to rTat, cocaine, or rTat and cocaine. b Quantification of intracellular lactate levels in control and MCU KD astrocytes exposed to rTat, cocaine, or rTat and cocaine. c Quantification of LDH activity in control and MCU KD astrocytes exposed to rTat, cocaine, or rTat and cocaine. d Quantification of pyruvate levels in control and MCU KD astrocytes exposed to rTat, cocaine, or rTat and cocaine. e Quantification of Acetyl-CoA levels in control and MCU KD astrocytes exposed to rTat, cocaine, or rTat and cocaine. g Cell lysates prepared from control and MCU KD astrocytes exposed to rTat, cocaine, or rTat and cocaine were assessed by Western blotting with antibodies specific for PDHA1 (phospho S293) and PDH. Quantification of normalized PDHA1 (phospho S293) levels with total PDH (h). i Measurement of OCR in control and MCU KD astrocytes exposed to rTat, cocaine, or rTat and cocaine. Representative traces of OCR in control (i) and MCU KD astrocytes (j). k, l Quantification of basal OCR (k), maximal OCR (l) in control and MCU KD astrocytes exposed to rTat, cocaine, or rTat and cocaine. m Quantification of cellular ATP levels in control and MCU KD astrocytes exposed to rTat, cocaine, or rTat and cocaine. Data indicate Mean ± SEM; ***P < 0.001, **P < 0.01, *P < 0.05; n = 24–30

