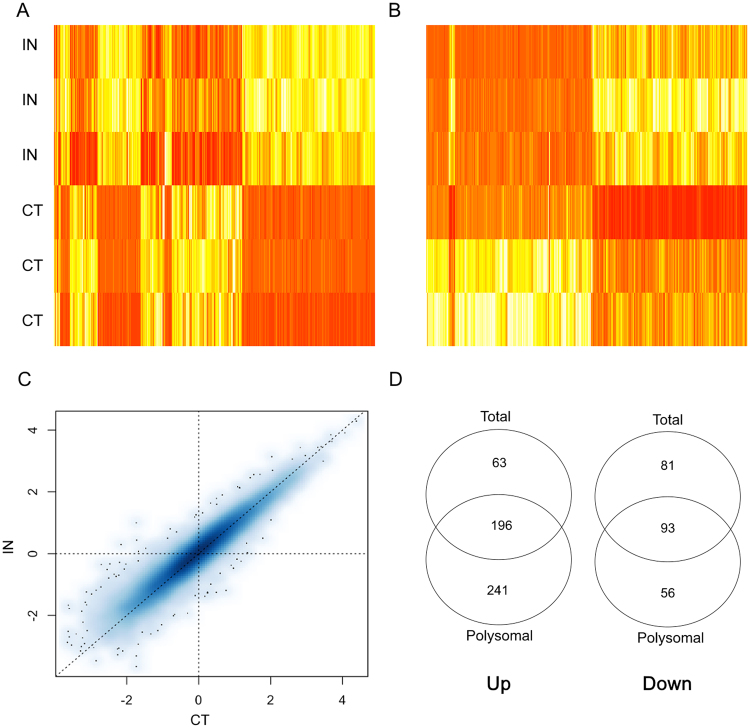
Figure 2.
Diagrams for differentially expressed genes (DEGs) on osteogenic-induced (IN) and non-induced (CT) cells. Heatmaps of the DEGs are shown for the polysomal RNA fraction (A) and for the total RNA fraction (B). Data are displayed with different samples in the rows (three biological replicates for IN and for CT) and color intensities represent gene upregulation (red) and downregulation (yellow). (C) Scatterplot of log-10 RPKM values representing each gene in the polysomal fraction (median of reads per kilobase per million mapped reads from all patients for CT and IN samples). (D) Venn diagrams picturing set relationships between DEGs in the polysomal and total RNA fractions for upregulated genes (Up; left) and for downregulated genes (Down; right).

