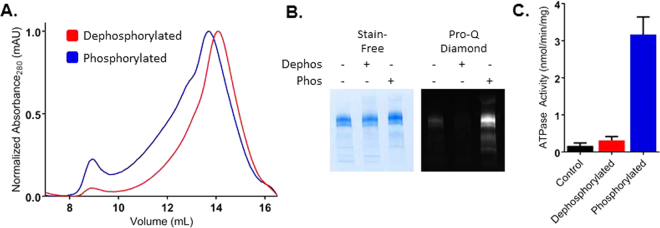
Figure 1.
FL hCFTRTS purification and activity. (A) Representative chromatograms for dephosphorylated (red) and PKA phosphorylated (blue) hCFTRTS run over a Superose 6 10/300 SEC column as a final purification step. (B) hCFTRTS after purification (no phosphatase or kinase treatment in lane (1), post λPP treatment in lane (2), and post PKA treatment in lane (3) was run on stain-free Bio-rad SDS-PAGE and imaged (left image). The same gel was then stained using Pro-Q Diamond Phosphoprotein Stain to confirm phosphorylation state after λPP and PKA treatment. The full-length gel images are shown in Figure S1B and C. (C) ATPase activity of purified dephosphorylated (red) and phosphorylated (blue) hCFTRTS at 0.5 µM in the presence of 5 mM ATP was measured using the PK/LDH coupled enzyme assay.

