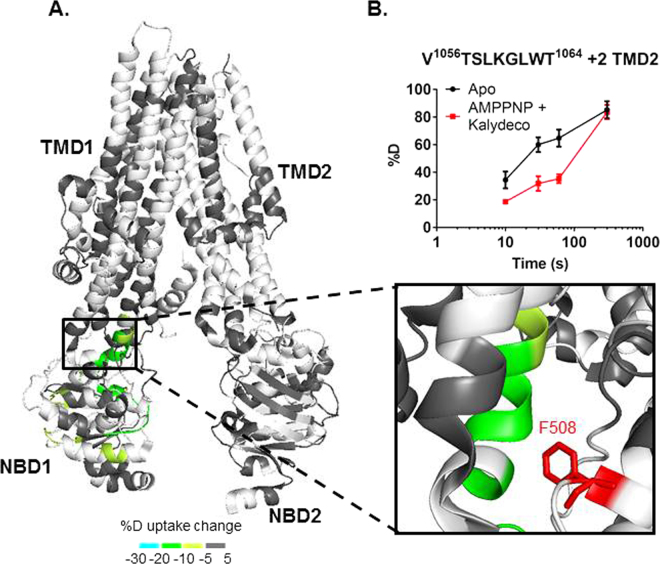
Figure 5.
hCFTRTS conformational changes when both AMPPNP and Kalydeco were bound. (A) HDX perturbation data mapped to the cryo-EM structure (PDB 5UAK). As shown in the key, a color gradient is used to represent the average deuterium uptake differences across all 6 time points between the apo and ligand bound states of hCFTRTS. White indicates regions that were not detected for every replicate at every time point in the HDX experiments. The ICL4 region was zoomed in to show the protected peptides. F508 was highlighted in red and represented as sticks. (B) Deuterium uptake time-course curves of the TMD2 peptide which showed protection upon ligand binding. Data represent the means ± SD (n = 2–3). Charge state of the peptide ion is also noted.

