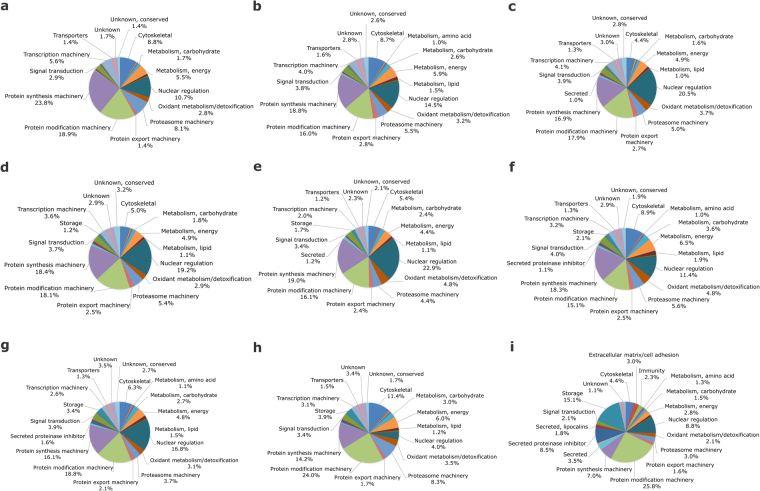
Figure 4.
Functional clusterisation of Rhipicephalus microplus ovary proteins. Proteomic analysis was performed in partially engorged females, groups PEF-10 (a), -24 (b), -35 (c), -53 (d), -84 (e), -189 (f), and -270 (g); and fully engorged females, groups FEF-D1 (h) and -D3 (i). Pie charts represent the percentage of proteins found in each group respective to normalised spectral counting (NSAF) for each sample. Numbers of ticks composing each group are: PEF-10 (n = 10), PEF-16 (n = 9), PEF-24 (n = 28), PEF-35 (n = 23), PEF-53 (n = 8), PEF-84 (n = 9), PEF-189 (n = 5), PEF-270 (n = 5). FEF groups D1, D2, D3, and D4 were composed by ovaries from 5 ticks.

