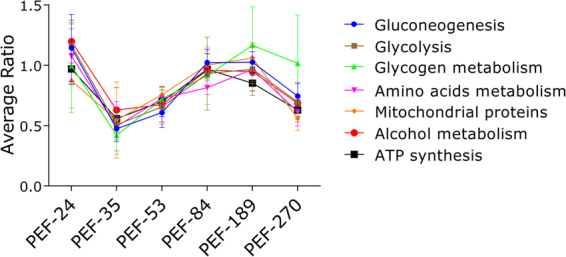
Figure 9.

Quantification of proteins in selected metabolic pathways related to vitellogenesis. Dimethyl labelling quantification was performed in ovary extracts of partially engorged female (PEF) groups -24, -35, -53, -84, 189, -270. The ratio is the intensity detected for each peptide, relative to the internal standard (a protein pool of all ovary groups used in this study). The average ratio of a protein is calculated as the mean ratio of its peptides. The average ratio of each metabolic pathway presented in this graph was calculated from the average quantification (with standard deviation) of enzymes involved in each pathway (Supplementary Fig. S1). Numbers of ticks composing each group are: PEF-10 (n = 10), PEF-16 (n = 9), PEF-24 (n = 28), PEF-35 (n = 23), PEF-53 (n = 8), PEF-84 (n = 9), PEF-189 (n = 5), PEF-270 (n = 5).
