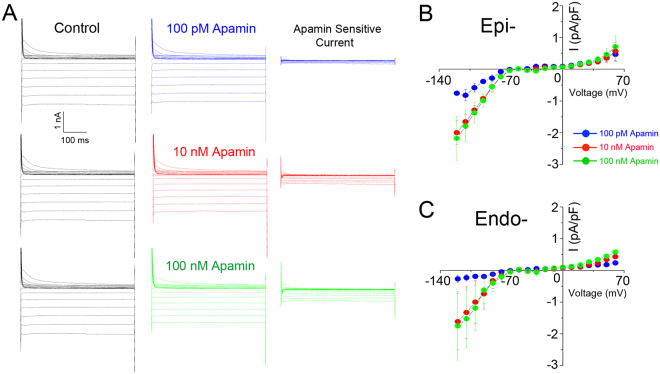
Figure 1.
Apamin-sensitive SK currents in rabbit ventricular myocytes. (A) Representative current traces elicited from a holding potential of −55 mV using a family of voltage steps from −120 mV to +60 mV at 10 mV increments with 500 ms durations. Current traces shown are recorded in control (black traces, left panels), after 100 pM (blue traces), 10 nM (red traces), and 100 nM (green traces) of apamin (middle panels). Current traces in the right panels are apamin-sensitive currents obtained from digital subtraction. (B and C) Summary data for the current-voltage relationship of apamin-sensitive SK currents recorded from epicardial (Epi-) (n = 5) and endocardial (Endo-) (n = 7) ventricular myocytes.

