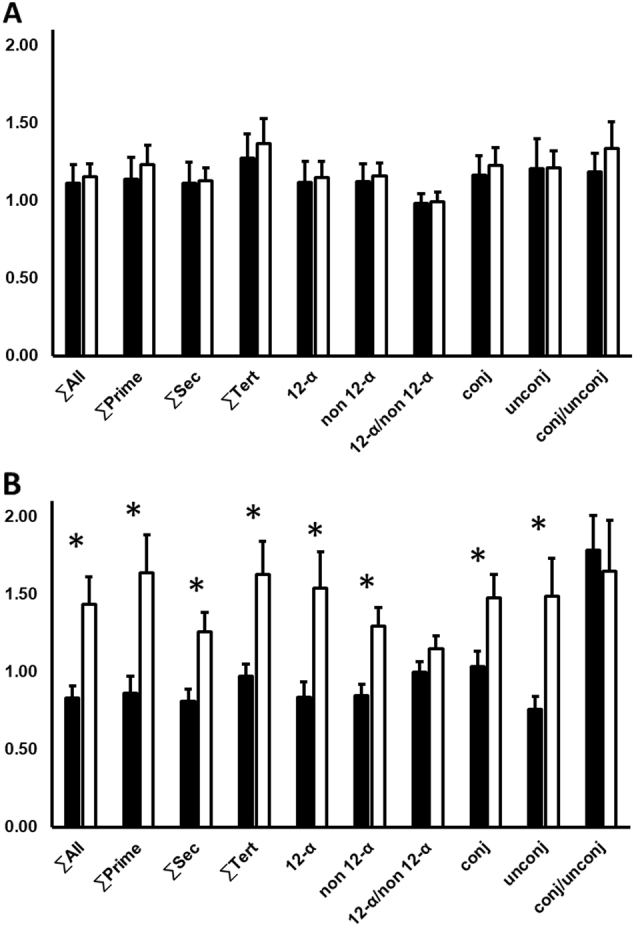
Fig. 1. Comparison of bile acids (BA) circulating concentrations between obese (n = 43; white bars) and overweight (n = 29; black bars) participants in the pooled cohort, irrespective of the dietary groups.

The graph shows changes relative to the baseline values (week 0) after a 6 weeks and b 18 weeks of dietary intervention. *Statistically significant at alpha < 0.05. ∑All: sum of all BA; ∑Prim: sum of primary BA; ∑Sec: sum of secondary BA; ∑Tert: sum of tertiary BA; 12-α: 12-α hydroxyl BA; non 12-α: non 12-α hydroxylated BA; 12-α/non 12-α: ratio of 12-α hydroxyl BA to non 12-α hydroxylated BA; Conj: conjugated BA; Unconj: unconjugated BA; Conj/Unconj: ratio of conjugated to unconjugated BA
