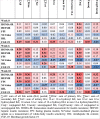
Table 3.
Partial correlation heat matrix at 0, 6, and 18 weeks between different bile acids (BA) and insulin resistance (IR) measures, intrahepatic lipid content (IHL) and fibroblast growth factor-19 (FGF-19) plasma levels, when corrected for age and body mass index (BMI), in the pooled cohort (n = 72; all four dietary groups and overweight and obese participants combined)

|
Bold font denotes significant correlations at α = 0.05; strength of color indicates the magnitude of the Pearson’s correlation value (r); red indicates positive and blue indicates negative correlations
∑All sum of all bile acids (BA) pooled, ∑Prim sum of primary BA, ∑Sec sum of secondary BA, ∑Tert sum of tertiary BA, 12-α 12-α hydroxyl BA, non 12-α non 12-α hydroxylated BA, 12-α/non 12-α = ratio of 12-α hydroxyl BA to non 12-α hydroxylated BA, Conj conjugated BA, Unconj unconjugated BA, Conj/Unconj ratio of conjugated to unconjugated BA, HOMA-IR homeostasis model assessment for insulin resistance, HEP-IR hepatic insulin resistance, FPI fasting plasma insulin, M-value insulin-mediated glucose uptake as a measurement of whole-body insulin sensitivity, IHL intrahepatic fat content, FGF-19 fibroblast growth factor-19
