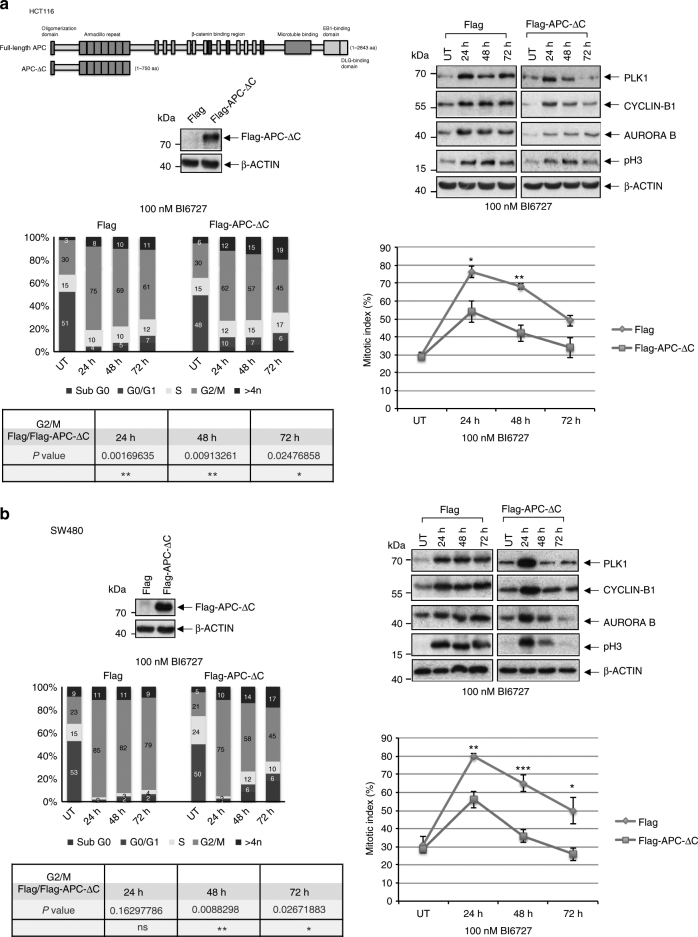
Fig. 1.
Correlation of PLK1 inhibition and mitotic arrest in APC-∆C-expressing colon cells. (Upper left) Schematic representation of full-length APC and the truncated form APC-∆C. Protein extracts from transfected colon cancer cell lines (a) HCT116 and (b) SW480 were blotted to detect Flag-tagged proteins. (Upper right) Cells were treated with 100 nM BI6727 followed by immunoblotting for PLK1, Cyclin B1, Aurora B, phosho-Histone H3 (pH3), and β-Actin. (Lower left) For the analysis of the cell cycle stage distribution of treated cells propidiumiodide was added to lysates which binds stoichiometrically to nucleic acids. After RNase-treatment and eliminating doublets or clumps the DNA-histogram determined by FACS gives information about the cell cycle. The representative quantification of the cell cycle analysis by FACS showing control (UT, untreated) and APC-ΔC-expressing cells treated for 24, 48, and 72 h with 100 nM BI6727; statistical evaluation of the percentages of cells in G2/M comparing APC-ΔC-expressing and control cells at 24, 48, and 72 h. (Lower right) The mitotic indices of cells treated with 100 nM BI6727 for 24, 48, and 72 h is depicted (means ± s.d., n = 3, for each concentration). *P < 0.05, **P < 0.01, ***P < 0.001, Student’s t-test, unpaired and two-tailed

