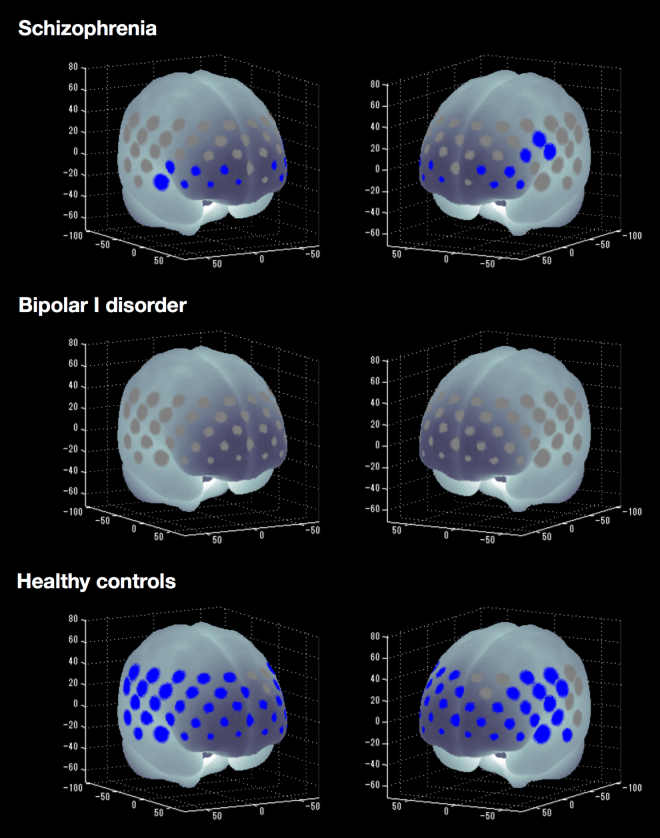
Figure 1.
P-value significance map of cognitive activation among patients with SZ or BD-I and HCs (false discovery rate [FDR]-corrected P < 0.05, corrected with 52 channels). Blue-coloured circles represent significantly increased mean oxy-Hb changes from pre-task baseline to the inhibitory control task period in schizophrenia, bipolar I disorder and healthy controls. Channels that showed no significant correlations are highlighted in grey.

