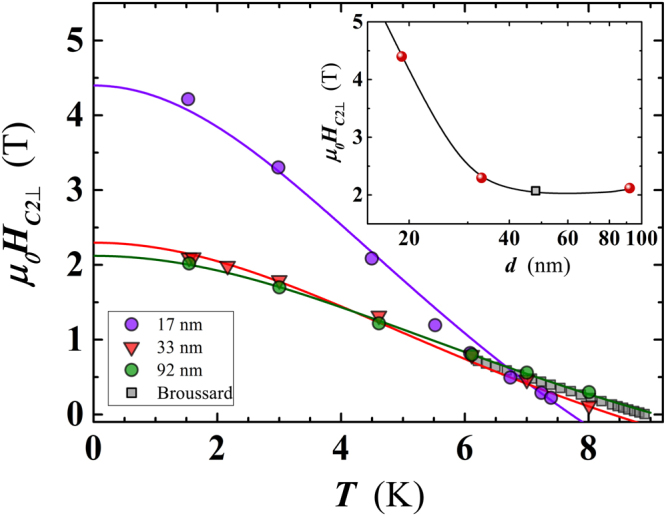
Figure 12.

Temperature dependence of the perpendicular critical magnetic field (HC2⊥). For each temperature, the corresponding HC2⊥ value has been derived as the mean value of the applied magnetic fields corresponding to 10% and 90% of the resistivity value at the saturation point (see Figure S3 in supplementary material). Lines are the least-squares fit of the data points by Eq. (5). For comparison, data of Broussard38 for the HC2⊥ of a 48 nm thick Nb film have been added to the plot. Inset: thickness dependence of at 1.6 K, for the three investigated Nb films (spheres) and for the sample of Broussard38 (square) whose value, at 1.6 K, has been extrapolated by Eq. (5) from the experimental data available down to ≈6 K. The black line serve as a guide for the eyes.
