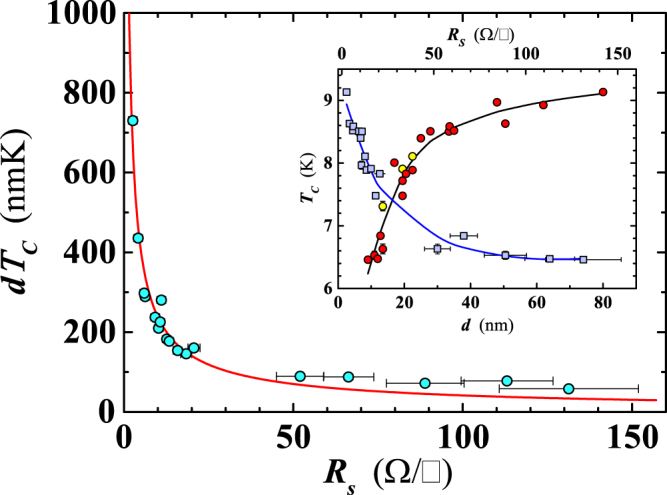
Figure 8.

Dependence of the product of the film thickness, d, and the superconducting transition temperature, TC, on the sheet resistance (Rs) for the investigated Nb nanofilms. The red line is the least-squares fit of the data obtained using Eq. (2). Inset reproduces the behavior of TC (circles) and of RS (squares) as a function of the thickness. Yellow filled symbols refer to samples deposited on sapphire substrates. Blue and black lines are guides for the eyes.
