Fig. 3.
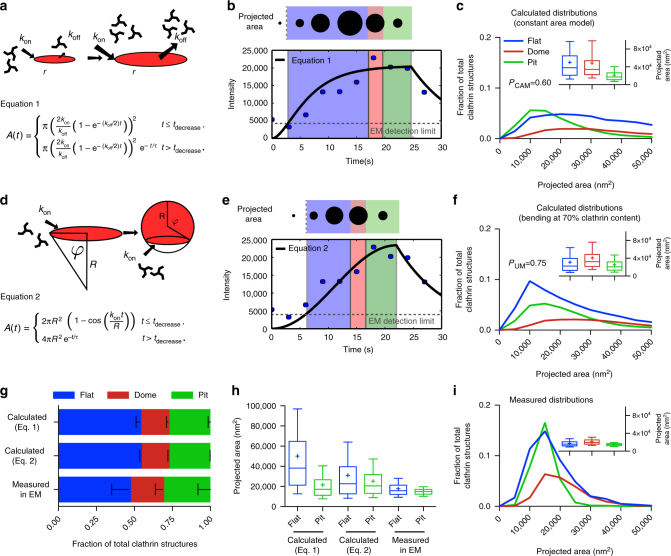
Mathematical modelling of CCS growth from intensity profiles of individual CME events. a Mathematical representation of the constant area model, flat-to-curved transition happens at the time when clathrin reaches its final content. b Example of a clathrin intensity track fitted by the constant area model. Blue dots represent measured intensity of a single CME event; black line represents the fit with Eq. 1, dashed grey line marks the EM detection limit. The schematic on the top illustrates the calculated projected area and assigned curvature, flat (blue), dome (red) and pit (green). c Calculated projected area and curvature distributions of the CCSs according to the constant area model for 4927 FM tracks of 4 different cells. P-value of Welch’s t-test to compare the predicted to the measured distribution in i. A box/whisker plot of the projected area is shown in the inset. Mid-line represents median, cross represents the mean and the whiskers represent the 10 and 90 percentiles. d Mathematical representation of the updated growth model where a flat clathrin patch grows and the flat-to-curved transition happens before reaching the final clathrin content. e, f Same as b, c but using Eq. 2. g Comparison of the predicted ratio of flat, dome and pit structures from both growth model (Eq. 1 (a) and Eq. 2 (d)) and the distribution obtained from TEM imaging. Results are calculated for 4927 FM tracks of 4 different cells; means with SD are shown. h Direct comparison of the projected area distribution of flat and pit structures calculated by Eqs. 1 and 2 as well as measured in EM, box/whisker plot. i Measured projected area and curvature distributions of the CCSs from TEM data as shown in Fig. 1

