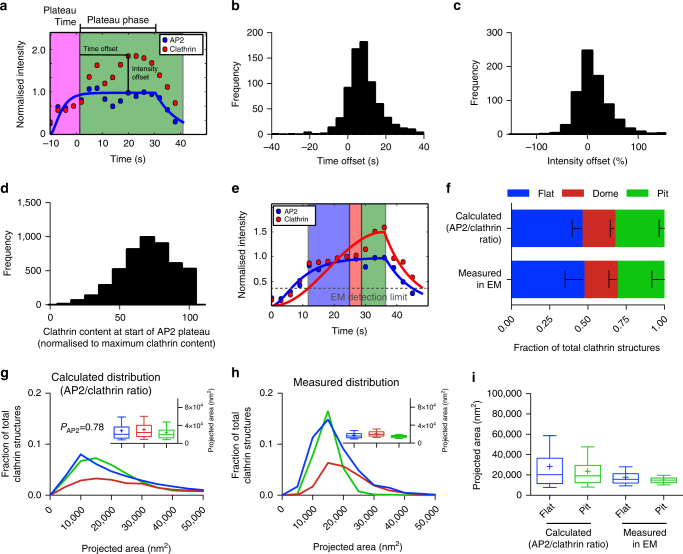
Fig. 5.
Change in the AP2/clathrin ratio is associated with flat-to-curved transition. a Example of an AP2 (blue) and clathrin (red) intensity profile from an individual CME event. The AP2 profile was fitted to Eq. 1 to find the time when AP2 signal plateaus. For more information see Supplementary Information. The fluorescence intensity of AP2 and clathrin was normalised to the fluorescence intensity of the time when the fitted AP2 profile reaches its plateau. Time offset (difference between the time AP2 plateaus and clathrin reaches its maximum intensity) and intensity offset (excess of maximal clathrin signal over AP2 maximum intensity) are indicated in the profiles. Quantification of the time offset (b) and the intensity offset (c) for 754 tracks of one single cell. d Quantification of the clathrin content at the time when AP2 reaches its plateau from 4927 FM tracks. The clathrin signal was normalised to the maximal clathrin signal in each track. e Example of an AP2 (blue) and clathrin (red) profile fitted to Eqs. 1 and 2, respectively. These fits were used to calculate the size and curvature distributions of the CCS in (f, g). For more information see Supplementary Information. f Comparison of the calculated ratio of flat, dome and pit structures to the measured ratio in TEM. Results calculated from 4927 FM tracks from 4 different cells; means with SD are shown. g Calculated projected area of the CCSs using a growth model where the flat-to-curved transition corroborates with the change of clathrin/AP2 ratio (when AP2 signal reaches its plateau phase) for 4927 FM tracks of 4 different cells. P-value of Welch’s t-test to compare the predicted to the measured distribution in (h). A box/whisker plot of the projected area is shown in the inset. h Measured projected area and curvature distributions of the CCSs from TEM data as shown in Fig. 1. A box/whisker plot of the projected area is shown in the inset. i Direct comparison of the projected area distribution of flat and pit structures calculated according to the AP2/clathrin ratio as well as measured in EM, box/whisker plot

