Fig. 7.
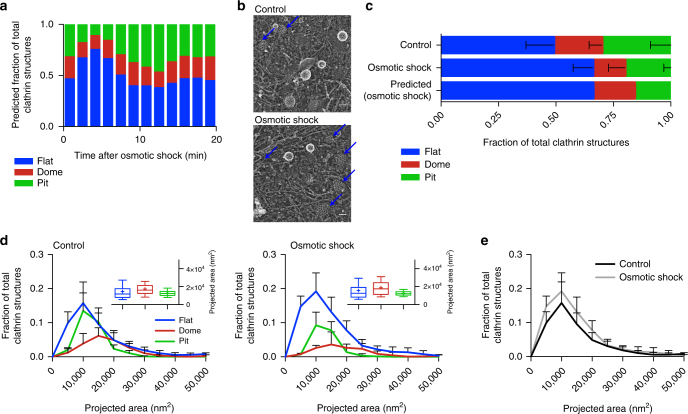
Osmotic shock blocks flat-to-curved transition of CCSs. a Predicted ratio of flat (blue), dome (red) and pit (green) structures calculated from the binned AP2 and clathrin profiles of CME events (Fig. 6c) during osmotic shock for 1357 tracks. b Examples of CCSs under normal and osmotic shock conditions. Blue arrows point to flat structures. c Comparison of measured and predicted frequency of flat, dome and pit structures under normal and osmotic shock conditions. d Projected area distribution of the different clathrin morphologies under normal and osmotic shock conditions. A box /whisker plot of the projected area is shown in the inset. Mid-line represents median, cross represents the mean and the whiskers represent the 10 and 90 percentiles. e Comparison of projected area distributions of flat CCSs under normal and osmotic shock conditions. Results are calculated from four different membranes (number of CCSs per membrane: normal conditions 267, 308, 229 and 323; osmotic shock: 395, 99, 351 and 201); means with SD are shown

