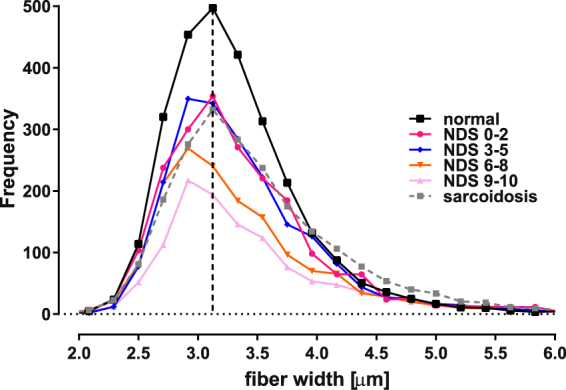
Figure 6.

The nerve fiber bundle width frequency distribution illustrates that a progressive dropout of nerve fiber bundles surrounding the mean of normal controls (3.13 µm; dashed vertical line) occurs as a function of increasing severity of neuropathic disability. The relative abundance of nerve fiber bundles having widths in the 2.7–4.0 µm range preferentially decreased compared to smaller and larger ones, resulting in asymmetrical curves for the neuropathy groups. Note that although the sarcoidosis group distribution was similar to the milder diabetic neuropathy groups in the <4.0 µm range, there was relative increase in the abundance of wider fibers compared to the diabetes subjects. (Also refer to Fig. S2).
