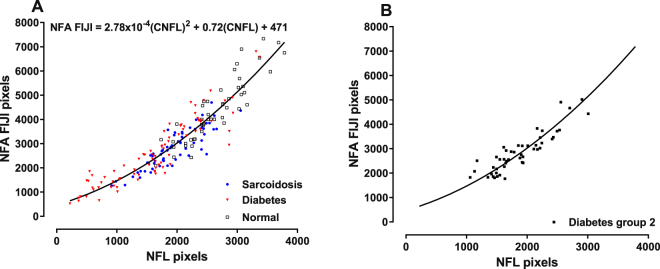
Figure 7.
(A) The relationship between NFL and NFA FIJI is characterized by a quadratic function. The change in slope of this curve shows that NFA changes more rapidly than NFL as nerve fiber densities approach normal (right portion of the curve). Conversely, differences bewteen these two variables are more similar in cases of severe neuropathy (left portion of the curve). (B) CCM data obtained using an independent (cross-validation) group of Type 2 diabetic subjects fall on the prediction curve from panel A.

